获取报表列表
方法: GET
描述: 该API用于列出所有报表
示例 URL: https://localhost:8060/api/json/reports/getReportsList?apiKey=***************&isFavouriteNeeded=true&hideintegratedReports=true&hideHardwareReport=true
示例响应: [ { "displayName": "System", "list": [ { "list": [ { "customStatus": "False", "displayName": "Notification Profiles Triggered", "isCustom": "false", "id": 6, "url": "/reports/GenerateReports.do?firstTime=true&reportID=6", "Name": "Notification Profiles Triggered", "desc": "Get report of notification profiles triggered" }, { "customStatus": "False", "displayName": "Downtime Scheduler Log", "isCustom": "false", "id": 7, "url": "/reports/GenerateReports.do?firstTime=true&reportID=7", "Name": "Downtime Scheduler Log", "desc": "Get report of downtime scheduler log" }, { "customStatus": "False", "displayName": "Schedule Reports Log", "isCustom": "false", "id": 8, "url": "/reports/GenerateReports.do?firstTime=true&reportID=8", "Name": "Schedule Reports Log", "desc": "Get report of schedule reports log" }, { "customStatus": "False", "displayName": "All Down Events", "isCustom": "false", "id": 2, "url": "/reports/GenerateReports.do?firstTime=true&reportID=2", "Name": "All Down Events", "desc": "Get report for all down events" }, { "customStatus": "False", "displayName": "All Alerts", "isCustom": "false", "id": 84, "isFavourite": "True", "url": "/reports/GenerateReports.do?firstTime=true&reportID=84", "Name": "All Alerts", "desc": "Get report for all alerts" }, { "customStatus": "False", "displayName": "All Events", "isCustom": "false", "id": 1, "isFavourite": "True", "url": "/reports/GenerateReports.do?firstTime=true&reportID=1", "Name": "All Events", "desc": "Get report for all events" }, { "customStatus": "False", "displayName": "All Down Alerts", "isCustom": "false", "id": 85, "url": "/reports/GenerateReports.do?firstTime=true&reportID=85", "Name": "All Down Alerts", "desc": "Get report for all down alerts" }, { "customStatus": "False", "displayName": "SNMP Trap Log", "isCustom": "false", "id": 3, "url": "/reports/GenerateReports.do?firstTime=true&reportID=3", "Name": "SNMP Trap Log", "desc": "Get SNMP trap log report" }, { "customStatus": "False", "displayName": "Windows Event Log", "isCustom": "false", "id": 4, "url": "/reports/GenerateReports.do?firstTime=true&reportID=4", "Name": "Windows Event Log", "desc": "Get windows event log report" }, { "customStatus": "False", "displayName": "Performance Monitor Error Log", "isCustom": "false", "id": 5, "url": "/reports/GenerateReports.do?firstTime=true&reportID=5", "Name": "Performance Monitor Error Log", "desc": "Get performance monitor error log report" }, { "customStatus": "False", "displayName": "All Alerts with Notes", "isCustom": "false", "id": 721, "url": "/reports/GenerateReports.do?firstTime=true&reportID=721", "Name": "All Alerts with Notes", "desc": "Get report for all alerts with Notes" }, { "customStatus": "False", "displayName": "Top SysLog Count by Source", "isCustom": "false", "id": 95, "url": "/reports/GenerateReports.do?firstTime=true&reportID=95", "Name": "webclient.top.syslog.reports", "desc": "Top N devices with most number of SysLogs" }, { "customStatus": "False", "displayName": "Top EventLog Count by Source", "isCustom": "false", "id": 94, "url": "/reports/GenerateReports.do?firstTime=true&reportID=94", "Name": "webclient.top.eventlog.reports", "desc": "Top N devices with most number of EventLogs" }, { "customStatus": "False", "displayName": "Top Trap Count by Source", "isCustom": "false", "id": 93, "url": "/reports/GenerateReports.do?firstTime=true&reportID=93", "Name": "webclient.top.trap.reports", "desc": "Top N devices with most number of Traps" }, { "customStatus": "False", "displayName": "Suppressed Devices", "isCustom": "false", "id": 92, "url": "/reports/GenerateReports.do?firstTime=true&reportID=92", "Name": "webclient.suppress.devices.reports", "desc": "Get report for suppressed devices" }, { "customStatus": "False", "displayName": "DataCollection Error Logs", "isCustom": "false", "id": 151, "url": "/reports/GenerateReports.do?firstTime=true&reportID=151", "Name": "widget.name.dataCollectionLog", "desc": "Get datacollection failure details" }, { "customStatus": "False", "displayName": "Active Alerts", "isCustom": "false", "id": 149, "url": "/reports/GenerateReports.do?firstTime=true&reportID=149", "Name": "webclient.report.name.activealarms", "desc": "Get report for active alerts" }, { "customStatus": "False", "displayName": "Workflow Logs", "isCustom": "false", "id": 90, "url": "/reports/GenerateReports.do?firstTime=true&reportID=90", "Name": "Workflow Logs", "desc": "Workflow logs report" }, { "customStatus": "False", "displayName": "Syslog Events", "isCustom": "false", "id": 88, "url": "/reports/GenerateReports.do?firstTime=true&reportID=88", "Name": "Syslog Events", "desc": "Get Syslog events report " }, { "displayName": "DataCollection Error Logs for N Consecutive Time(s)", "id": "ServerHealthReport", "desc": "Get datacollection failure details for N consecutive times" }, { "displayName": "Audit Report", "id": "Audit", "url": "/reports/AuditReport.do", "desc": "Audit Report" } ], "title": "" } ], "Name": "System" }, { "displayName": "Health and Performance", "list": [ { "list": [ { "customStatus": "True", "displayName": "Servers by Rx Utilization", "isCustom": "true", "id": 28, "url": "/reports/GenerateReports.do?firstTime=true&reportID=28", "Name": "Servers by Rx Utilization", "desc": "Identify servers with heavy incoming traffic utilization" }, { "customStatus": "True", "displayName": "Servers by Tx Utilization", "isCustom": "true", "id": 29, "url": "/reports/GenerateReports.do?firstTime=true&reportID=29", "Name": "Servers by Tx Utilization", "desc": "Identify servers with heavy outgoing traffic utilization" }, { "customStatus": "True", "displayName": "Volumes with Least Free Space", "isCustom": "true", "id": 30, "url": "/reports/GenerateReports.do?firstTime=true&reportID=30", "Name": "Volumes with Least Free Space", "desc": "Identify disk partitions with least free space" }, { "customStatus": "True", "displayName": "Volumes with Most Free Space", "isCustom": "true", "id": 31, "url": "/reports/GenerateReports.do?firstTime=true&reportID=31", "Name": "Volumes with Most Free Space", "desc": "Identify disk partitions with most free space" }, { "customStatus": "True", "displayName": "All Servers Disk Usage Report", "isCustom": "true", "id": 32, "url": "/reports/GenerateReports.do?firstTime=true&reportID=32", "Name": "All Servers Disk Usage Report", "desc": "Get partition wise disk usage report for all servers" }, { "customStatus": "True", "displayName": "Routers Health Report", "isCustom": "true", "id": 33, "url": "/reports/GenerateReports.do?firstTime=true&reportID=33", "Name": "Routers Health Report", "desc": "Get health report of routers" }, { "customStatus": "True", "displayName": "Routers by CPU Utilization", "isCustom": "true", "id": 34, "url": "/reports/GenerateReports.do?firstTime=true&reportID=34", "Name": "Routers by CPU Utilization", "desc": "Identify busy routers with high CPU Utilization" }, { "customStatus": "True", "displayName": "Routers by Memory Utilization", "isCustom": "true", "id": 35, "url": "/reports/GenerateReports.do?firstTime=true&reportID=35", "Name": "Routers by Memory Utilization", "desc": "Identify overloaded routers with high Memory Utilization" }, { "customStatus": "True", "displayName": "Router Interfaces by Rx Traffic", "isCustom": "true", "id": 36, "url": "/reports/GenerateReports.do?firstTime=true&reportID=36", "Name": "Router Interfaces by Rx Traffic", "desc": "Identify interfaces with heavy incoming traffic" }, { "customStatus": "True", "displayName": "Router Interfaces by Tx Traffic", "isCustom": "true", "id": 37, "url": "/reports/GenerateReports.do?firstTime=true&reportID=37", "Name": "Router Interfaces by Tx Traffic", "desc": "Identify interfaces with heavy outgoing traffic" }, { "customStatus": "True", "displayName": "Router Interfaces by Rx Errors", "isCustom": "true", "id": 38, "url": "/reports/GenerateReports.do?firstTime=true&reportID=38", "Name": "Router Interfaces by Rx Errors", "desc": "Identify interfaces with high incoming errors" }, { "customStatus": "True", "displayName": "Router Interfaces by Tx Errors", "isCustom": "true", "id": 39, "url": "/reports/GenerateReports.do?firstTime=true&reportID=39", "Name": "Router Interfaces by Tx Errors", "desc": "Identify interfaces with high incoming errors" }, { "customStatus": "True", "displayName": "Router Interfaces by Rx Utilization", "isCustom": "true", "id": 40, "url": "/reports/GenerateReports.do?firstTime=true&reportID=40", "Name": "Router Interfaces by Rx Utilization", "desc": "Identify interfaces with high % Receive utilization" }, { "customStatus": "True", "displayName": "Router Interfaces by Tx Utilization", "isCustom": "true", "id": 41, "url": "/reports/GenerateReports.do?firstTime=true&reportID=41", "Name": "Router Interfaces by Tx Utilization", "desc": "Identify interfaces with high % Transmit utilization" }, { "customStatus": "True", "displayName": "Switches Health Report", "isCustom": "true", "id": 42, "url": "/reports/GenerateReports.do?firstTime=true&reportID=42", "Name": "Switches Health Report", "desc": "Get health report of switches" }, { "customStatus": "True", "displayName": "Ports by Rx Traffic", "isCustom": "true", "id": 43, "url": "/reports/GenerateReports.do?firstTime=true&reportID=43", "Name": "Ports by Rx Traffic", "desc": "Identify ports with heavy incoming traffic" }, { "customStatus": "True", "displayName": "Ports by Tx Traffic", "isCustom": "true", "id": 44, "url": "/reports/GenerateReports.do?firstTime=true&reportID=44", "Name": "Ports by Tx Traffic", "desc": "Identify ports with heavy outgoing traffic" }, { "customStatus": "True", "displayName": "Ports by Rx Errors", "isCustom": "true", "id": 45, "url": "/reports/GenerateReports.do?firstTime=true&reportID=45", "Name": "Ports by Rx Errors", "desc": "Identify ports with most Receive errors" }, { "customStatus": "True", "displayName": "Ports by Tx Errors", "isCustom": "true", "id": 46, "url": "/reports/GenerateReports.do?firstTime=true&reportID=46", "Name": "Ports by Tx Errors", "desc": "Identify ports with most Transmit errors" }, { "customStatus": "True", "displayName": "Ports by Tx Utilization", "isCustom": "true", "id": 48, "url": "/reports/GenerateReports.do?firstTime=true&reportID=48", "Name": "Ports by Tx Utilization", "desc": "Identify ports with high % Transmit utilization" }, { "customStatus": "True", "displayName": "DCs by CPU Utilization", "isCustom": "true", "id": 49, "url": "/reports/GenerateReports.do?firstTime=true&reportID=49", "Name": "DCs by CPU Utilization", "desc": "Identify busy DCs with high CPU Utilization" }, { "customStatus": "True", "displayName": "DCs by Memory Utilization", "isCustom": "true", "id": 50, "url": "/reports/GenerateReports.do?firstTime=true&reportID=50", "Name": "DCs by Memory Utilization", "desc": "Identify overloaded DCs with high Memory Utilization" }, { "customStatus": "True", "displayName": "DCs by Disk Utilization", "isCustom": "true", "id": 51, "url": "/reports/GenerateReports.do?firstTime=true&reportID=51", "Name": "DCs by Disk Utilization", "desc": "Identify overloaded DCs with high Disk Utilization" }, { "customStatus": "True", "displayName": "Ports by Rx Utilization", "isCustom": "true", "id": 47, "url": "/reports/GenerateReports.do?firstTime=true&reportID=47", "Name": "Ports by Rx Utilization", "desc": "Identify ports with high % Receive utilization" }, { "customStatus": "False", "displayName": "Health Report", "isCustom": "false", "id": 9, "url": "/reports/GenerateReports.do?firstTime=true&reportID=9", "Name": "Health Report", "desc": "Get health report of all devices" }, { "customStatus": "False", "displayName": "Devices by CPU Utilization", "isCustom": "false", "id": 10, "url": "/reports/GenerateReports.do?firstTime=true&reportID=10", "Name": "Devices by CPU Utilization", "desc": "Identify overloaded devices with high CPU Utilization" }, { "customStatus": "False", "displayName": "Devices by Memory Utilization", "isCustom": "false", "id": 11, "url": "/reports/GenerateReports.do?firstTime=true&reportID=11", "Name": "Devices by Memory Utilization", "desc": "Identify overloaded devices with high Memory Utilization" }, { "customStatus": "False", "displayName": "Devices by Disk Utilization", "isCustom": "false", "id": 12, "url": "/reports/GenerateReports.do?firstTime=true&reportID=12", "Name": "Devices by Disk Utilization", "desc": "Identify overloaded devices with high Disk Utilization" }, { "customStatus": "False", "displayName": "Disk Usage by Drives", "isCustom": "false", "id": 13, "url": "/reports/GenerateReports.do?firstTime=true&reportID=13", "Name": "Disk Usage by Drives", "desc": "Identify overloaded devices with high Disk Utilization by drives" }, { "customStatus": "False", "displayName": "All Interfaces by Utilization", "isCustom": "false", "id": 14, "url": "/reports/GenerateReports.do?firstTime=true&reportID=14", "Name": "All Interfaces by Utilization", "desc": "Identify devices with heavy traffic utilization" }, { "customStatus": "False", "displayName": "WAN Links by Utilization", "isCustom": "false", "id": 15, "isFavourite": "True", "url": "/reports/GenerateReports.do?firstTime=true&reportID=15", "Name": "WAN Links by Utilization", "desc": "Identify WAN links with heavy traffic utilization" }, { "customStatus": "False", "displayName": "Interfaces by Rx Traffic", "isCustom": "false", "id": 16, "url": "/reports/GenerateReports.do?firstTime=true&reportID=16", "Name": "Interfaces by Rx Traffic", "desc": "Identify devices with heavy incoming traffic" }, { "customStatus": "False", "displayName": "Interfaces by Tx Traffic", "isCustom": "false", "id": 17, "url": "/reports/GenerateReports.do?firstTime=true&reportID=17", "Name": "Interfaces by Tx Traffic", "desc": "Identify devices with heavy outgoing traffic" }, { "customStatus": "False", "displayName": "Interfaces by Rx Utilization", "isCustom": "false", "id": 18, "url": "/reports/GenerateReports.do?firstTime=true&reportID=18", "Name": "Interfaces by Rx Utilization", "desc": "Identify devices with heavy incoming traffic utilization" }, { "customStatus": "False", "displayName": "Interfaces by Tx Utilization", "isCustom": "false", "id": 19, "url": "/reports/GenerateReports.do?firstTime=true&reportID=19", "Name": "Interfaces by Tx Utilization", "desc": "Identify devices with heavy outgoing traffic utilization" }, { "customStatus": "False", "displayName": "Interfaces by Rx Errors", "isCustom": "false", "id": 20, "url": "/reports/GenerateReports.do?firstTime=true&reportID=20", "Name": "Interfaces by Rx Errors", "desc": "Identify interfaces with high incoming errors" }, { "customStatus": "False", "displayName": "Interfaces by Tx Errors", "isCustom": "false", "id": 21, "url": "/reports/GenerateReports.do?firstTime=true&reportID=21", "Name": "Interfaces by Tx Errors", "desc": "Identify interfaces with high outgoing errors" }, { "customStatus": "True", "displayName": "Servers Health Report", "isCustom": "true", "id": 22, "isFavourite": "True", "url": "/reports/GenerateReports.do?firstTime=true&reportID=22", "Name": "Servers Health Report", "desc": "Get health report of servers" }, { "customStatus": "True", "displayName": "Servers by CPU Utilization", "isCustom": "true", "id": 23, "url": "/reports/GenerateReports.do?firstTime=true&reportID=23", "Name": "Servers by CPU Utilization", "desc": "Identify busy servers with high CPU Utilization" }, { "customStatus": "True", "displayName": "Servers by Memory Utilization", "isCustom": "true", "id": 24, "url": "/reports/GenerateReports.do?firstTime=true&reportID=24", "Name": "Servers by Memory Utilization", "desc": "Identify overloaded servers with high Memory Utilization" }, { "customStatus": "True", "displayName": "Servers by Disk Utilization", "isCustom": "true", "id": 25, "url": "/reports/GenerateReports.do?firstTime=true&reportID=25", "Name": "Servers by Disk Utilization", "desc": "Identify overloaded servers with high Disk Utilization" }, { "customStatus": "True", "displayName": "Servers by Rx Traffic", "isCustom": "true", "id": 26, "url": "/reports/GenerateReports.do?firstTime=true&reportID=26", "Name": "Servers by Rx Traffic", "desc": "Identify servers with heavy incoming traffic" }, { "customStatus": "True", "displayName": "Servers by Tx Traffic", "isCustom": "true", "id": 27, "url": "/reports/GenerateReports.do?firstTime=true&reportID=27", "Name": "Servers by Tx Traffic", "desc": "Identify servers with heavy outgoing traffic" }, { "customStatus": "True", "displayName": "All Interfaces By Traffic", "isCustom": "true", "id": 81, "url": "/reports/GenerateReports.do?firstTime=true&reportID=81", "Name": "All Interfaces By Traffic", "desc": "Get traffic report of all interfaces" }, { "customStatus": "True", "displayName": "Volumes With Low Disk Utilization", "isCustom": "true", "id": 82, "url": "/reports/GenerateReports.do?firstTime=true&reportID=82", "Name": "Volumes With Low Disk Utilization", "desc": "Identify volumes with low disk utilization" }, { "customStatus": "True", "displayName": "Volumes With High Disk Utilization", "isCustom": "true", "id": 83, "url": "/reports/GenerateReports.do?firstTime=true&reportID=83", "Name": "Volumes With High Disk Utilization", "desc": "Identify volumes with high disk utilization" }, { "customStatus": "False", "displayName": "Top N Errors And Discards", "isCustom": "false", "id": 86, "url": "/reports/GenerateReports.do?firstTime=true&reportID=86", "Name": "Top N Errors And Discards", "desc": "Identify interfaces with high errors and discards" }, { "customStatus": "False", "displayName": "Interfaces By TotalBytes Transfered", "isCustom": "false", "id": 89, "url": "/reports/GenerateReports.do?firstTime=true&reportID=89", "Name": "Interfaces By TotalBytes Transfered", "desc": "Identify interfaces with high total bytes transfered" }, { "customStatus": "False", "displayName": "Hardware Health Report", "isCustom": "false", "id": 142, "url": "/reports/GenerateReports.do?firstTime=true&reportID=142", "Name": "webclient.reports.hardware.title", "desc": "Get Hardware Health Report" }, { "customStatus": "True", "displayName": "Processes by CPU Utilization", "isCustom": "true", "id": 144, "url": "/reports/GenerateReports.do?firstTime=true&reportID=144", "Name": "Processes by CPU Utilization", "desc": "Identify processes with high CPU Utilization" }, { "customStatus": "True", "displayName": "Processes by Memory Utilization", "isCustom": "true", "id": 145, "url": "/reports/GenerateReports.do?firstTime=true&reportID=145", "Name": "Processes by Memory Utilization", "desc": "Identify processes with high Memory Utilization" }, { "customStatus": "True", "displayName": "Processes by Absolute Memory", "isCustom": "true", "id": 148, "url": "/reports/GenerateReports.do?firstTime=true&reportID=148", "Name": "Processes by Absolute Memory", "desc": "Identify absolute memory value of the Process" }, { "customStatus": "False", "displayName": "Flap Count Summary", "isCustom": "false", "id": 768, "url": "/reports/GenerateReports.do?firstTime=true&reportID=768", "Name": "webclient.bgp.title.flapCount", "desc": "Get Flap Count Summary for BGP Peers" }, { "customStatus": "False", "displayName": "Flap Summary", "isCustom": "false", "id": 769, "url": "/reports/GenerateReports.do?firstTime=true&reportID=769", "Name": "webclient.bgp.title.flapSummary", "desc": "Flap Summary for each BGP Peers" }, { "customStatus": "False", "displayName": "Devices with Performance Monitors", "isCustom": "false", "id": 772, "url": "/reports/GenerateReports.do?firstTime=true&reportID=772", "Name": "webclient.perf.monitors.report", "desc": "Get report for devices with Perforamance monitors" }, { "customStatus": "False", "displayName": "Devices with File Monitors", "isCustom": "false", "id": 773, "url": "/reports/GenerateReports.do?firstTime=true&reportID=773", "Name": "webclient.file.monitors.report", "desc": "Get report for devices with File monitors" }, { "customStatus": "False", "displayName": "Devices with Folder Monitors", "isCustom": "false", "id": 774, "url": "/reports/GenerateReports.do?firstTime=true&reportID=774", "Name": "webclient.folder.monitors.report", "desc": "Get report for devices with Folder monitors" }, { "customStatus": "False", "displayName": "Devices with Process Monitors", "isCustom": "false", "id": 775, "url": "/reports/GenerateReports.do?firstTime=true&reportID=775", "Name": "webclient.process.monitors.report", "desc": "Get report for devices with Process monitors" }, { "customStatus": "False", "displayName": "Devices with AD Monitors", "isCustom": "false", "id": 776, "url": "/reports/GenerateReports.do?firstTime=true&reportID=776", "Name": "webclient.AD.monitors.report", "desc": "Get report for devices with AD monitors" }, { "customStatus": "False", "displayName": "Devices with Exchange Monitors", "isCustom": "false", "id": 777, "url": "/reports/GenerateReports.do?firstTime=true&reportID=777", "Name": "webclient.exchange.monitors.report", "desc": "Get report for devices with Exchange monitors" }, { "customStatus": "False", "displayName": "Devices with MSSQL Monitors", "isCustom": "false", "id": 778, "url": "/reports/GenerateReports.do?firstTime=true&reportID=778", "Name": "webclient.mssql.monitors.report", "desc": "Get report for devices with MSSQL monitors" }, { "customStatus": "False", "displayName": "Devices with AD Service Monitors", "isCustom": "false", "id": 779, "url": "/reports/GenerateReports.do?firstTime=true&reportID=779", "Name": "webclient.ADService.monitors.report", "desc": "Get report for devices with AD Service monitors" }, { "customStatus": "False", "displayName": "Devices with MSSQL Service Monitors", "isCustom": "false", "id": 780, "url": "/reports/GenerateReports.do?firstTime=true&reportID=780", "Name": "webclient.mssqlservice.monitors.report", "desc": "Get report for devices with MSSQL Service monitors" }, { "customStatus": "False", "displayName": "Devices with Exchange Service Monitors", "isCustom": "false", "id": 781, "url": "/reports/GenerateReports.do?firstTime=true&reportID=781", "Name": "webclient.exchangeservice.monitors.report", "desc": "Get report for devices with Exchange Service monitors" }, { "customStatus": "False", "displayName": "Devices with NT Service Monitors", "isCustom": "false", "id": 782, "url": "/reports/GenerateReports.do?firstTime=true&reportID=782", "Name": "webclient.ntservice.monitors.report", "desc": "Get report for devices with NT Service monitors" }, { "customStatus": "False", "displayName": "Devices with URL Monitors", "isCustom": "false", "id": 783, "url": "/reports/GenerateReports.do?firstTime=true&reportID=783", "Name": "webclient.url.monitors.report", "desc": "Get report for devices with URL monitors" }, { "customStatus": "False", "displayName": "Devices with Service Monitors", "isCustom": "false", "id": 784, "url": "/reports/GenerateReports.do?firstTime=true&reportID=784", "Name": "webclient.service.monitors.report", "desc": "Get report for devices with Service monitors" }, { "customStatus": "False", "displayName": "VPN Summary", "isCustom": "false", "id": 895, "url": "/reports/GenerateReports.do?firstTime=true&reportID=895", "Name": "webclient.opm.reports.vpnSummary", "desc": "Get summary report for Site-to-Site VPN devices." } ], "title": "" } ], "Name": "Health and Performance" }, { "displayName": "Availability and Response", "list": [ { "list": [ { "customStatus": "True", "displayName": "SMTP Servers by Response Time", "isCustom": "true", "id": 65, "url": "/reports/GenerateReports.do?firstTime=true&reportID=65", "Name": "SMTP Servers by Response Time", "desc": "Identify SMTP servers with high Response Time" }, { "customStatus": "True", "displayName": "Process Monitors Availability", "isCustom": "true", "id": 146, "url": "/reports/GenerateReports.do?firstTime=true&reportID=146", "Name": "Process Monitors Availability", "desc": "Get availability report for all process monitors" }, { "customStatus": "True", "displayName": "Windows Service Monitors Availability", "isCustom": "true", "id": 147, "url": "/reports/GenerateReports.do?firstTime=true&reportID=147", "Name": "Windows Service Monitors Availability", "desc": "Get availability report for all windows service monitors" }, { "customStatus": "True", "displayName": "HTTP Servers by Response Time", "isCustom": "true", "id": 64, "url": "/reports/GenerateReports.do?firstTime=true&reportID=64", "Name": "HTTP Servers by Response Time", "desc": "Identify Web servers with high Response Time" }, { "customStatus": "False", "displayName": "Devices by Packet Loss", "isCustom": "false", "id": 58, "url": "/reports/GenerateReports.do?firstTime=true&reportID=58", "Name": "Devices by Packet Loss", "desc": "Identify devices with high packet loss" }, { "customStatus": "False", "displayName": "Devices by Response Time", "isCustom": "false", "id": 57, "url": "/reports/GenerateReports.do?firstTime=true&reportID=57", "Name": "Devices by Response Time", "desc": "Identify devices with high response time" }, { "customStatus": "True", "displayName": "Web Servers Availability", "isCustom": "true", "id": 63, "url": "/reports/GenerateReports.do?firstTime=true&reportID=63", "Name": "Web Servers Availability", "desc": "Get availability report for all web servers" }, { "customStatus": "False", "displayName": "WAN Links Availability", "isCustom": "false", "id": 54, "isFavourite": "True", "url": "/reports/GenerateReports.do?firstTime=true&reportID=54", "Name": "WAN Links Availability", "desc": "Get availability report for all interfaces" }, { "customStatus": "False", "displayName": "All Interfaces Availability", "isCustom": "false", "id": 87, "isFavourite": "True", "url": "/reports/GenerateReports.do?firstTime=true&reportID=87", "Name": "All Interfaces Availability", "desc": "Get availability report for all interfaces" }, { "customStatus": "False", "displayName": "URLs Availability", "isCustom": "false", "id": 55, "url": "/reports/GenerateReports.do?firstTime=true&reportID=55", "Name": "URLs Availability", "desc": "Get availability report for all URLs" }, { "customStatus": "False", "displayName": "Service Monitors Availability", "isCustom": "false", "id": 56, "isFavourite": "True", "url": "/reports/GenerateReports.do?firstTime=true&reportID=56", "Name": "Service Monitors Availability", "desc": "Get availability report for all service monitors" }, { "customStatus": "True", "displayName": "DCs Availability Report", "isCustom": "true", "id": 62, "url": "/reports/GenerateReports.do?firstTime=true&reportID=62", "Name": "DCs Availability Report", "desc": "Get availability report for all DCs" }, { "customStatus": "True", "displayName": "Servers Availability Report", "isCustom": "true", "id": 61, "url": "/reports/GenerateReports.do?firstTime=true&reportID=61", "Name": "Servers Availability Report", "desc": "Get availability report for all services" }, { "customStatus": "False", "displayName": "Devices Availability", "isCustom": "false", "id": 52, "url": "/reports/GenerateReports.do?firstTime=true&reportID=52", "Name": "Devices Availability", "desc": "Get availability report for all devices" }, { "customStatus": "False", "displayName": "Devices Availability Dashboard", "isCustom": "false", "id": 53, "url": "/reports/GenerateReports.do?firstTime=true&reportID=53", "Name": "Devices Availability Dashboard", "desc": "Get availability report for all devices" }, { "customStatus": "False", "displayName": "DownTime Report For Interfaces", "isCustom": "false", "id": 724, "url": "/reports/GenerateReports.do?firstTime=true&reportID=724", "Name": "DownTime Report For Interfaces", "desc": "DownTime history for all interfaces" }, { "customStatus": "False", "displayName": "Services by Response Time", "isCustom": "false", "id": 60, "url": "/reports/GenerateReports.do?firstTime=true&reportID=60", "Name": "Services by Response Time", "desc": "Identify services with high response time" }, { "customStatus": "False", "displayName": "URLs by Response Time", "isCustom": "false", "id": 59, "url": "/reports/GenerateReports.do?firstTime=true&reportID=59", "Name": "URLs by Response Time", "desc": "Identify URLs with high response time" }, { "customStatus": "True", "displayName": "Telnet Servers by Response Time", "isCustom": "true", "id": 68, "url": "/reports/GenerateReports.do?firstTime=true&reportID=68", "Name": "Telnet Servers by Response Time", "desc": "Identify Telnet servers with high Response Time" }, { "customStatus": "False", "displayName": "DownTime Report", "isCustom": "false", "id": 91, "url": "/reports/GenerateReports.do?firstTime=true&reportID=91", "Name": "DownTime Report", "desc": "DownTime history for all devices" }, { "customStatus": "True", "displayName": "FTP Servers by Response Time", "isCustom": "true", "id": 67, "url": "/reports/GenerateReports.do?firstTime=true&reportID=67", "Name": "FTP Servers by Response Time", "desc": "Identify FTP servers with high Response Time" }, { "customStatus": "True", "displayName": "MySQL Servers by Response Time", "isCustom": "true", "id": 66, "url": "/reports/GenerateReports.do?firstTime=true&reportID=66", "Name": "MySQL Servers by Response Time", "desc": "Identify MySQL servers with high Response Time" } ], "title": "" } ], "Name": "Availability and Response" }, { "displayName": "Inventory", "list": [ { "list": [ { "customStatus": "True", "displayName": "Devices Down", "isCustom": "true", "id": 722, "url": "/reports/GenerateReports.do?firstTime=true&reportID=722", "Name": "widget.name.devicesdown", "desc": "Get report for all devices down" }, { "customStatus": "False", "displayName": "Notification Profiles Applied by Type", "isCustom": "false", "id": 72, "url": "/reports/GenerateReports.do?firstTime=true&reportID=72", "Name": "Notification Profiles Applied by Type", "desc": "Get report of all notification profiles applied by profile type" }, { "customStatus": "False", "displayName": "Notification Profiles Applied", "isCustom": "false", "id": 71, "url": "/reports/GenerateReports.do?firstTime=true&reportID=71", "Name": "Notification Profiles Applied", "desc": "Get report of all notification profiles applied" }, { "customStatus": "False", "displayName": "Devices by Category", "isCustom": "false", "id": 70, "isFavourite": "True", "url": "/reports/GenerateReports.do?firstTime=true&reportID=70", "Name": "Devices by Category", "desc": "Get inventory report of devices by device category" }, { "customStatus": "False", "displayName": "Devices by Device Type", "isCustom": "false", "id": 69, "url": "/reports/GenerateReports.do?firstTime=true&reportID=69", "Name": "Devices by Device Type", "desc": "Get inventory report of devices by device type" }, { "customStatus": "False", "displayName": "Hardware Information", "isCustom": "false", "id": 155, "url": "/reports/GenerateReports.do?firstTime=true&reportID=155", "Name": "webclient.reports.hardwareinfo.title", "desc": "Get report of Hardware Information" }, { "customStatus": "True", "displayName": "Non SNMP Devices", "isCustom": "true", "id": 80, "url": "/reports/GenerateReports.do?firstTime=true&reportID=80", "Name": "Non SNMP Devices", "desc": "Get inventory report of all SNMP not enabled devices" }, { "customStatus": "True", "displayName": "SNMP Enabled Devices", "isCustom": "true", "id": 79, "url": "/reports/GenerateReports.do?firstTime=true&reportID=79", "Name": "SNMP Enabled Devices", "desc": "Get inventory report of all SNMP enabled devices" }, { "customStatus": "True", "displayName": "Desktop", "isCustom": "true", "id": 78, "url": "/reports/GenerateReports.do?firstTime=true&reportID=78", "Name": "Desktops", "desc": "Get inventory report of desktops" }, { "customStatus": "True", "displayName": "Server", "isCustom": "true", "id": 77, "url": "/reports/GenerateReports.do?firstTime=true&reportID=77", "Name": "Servers", "desc": "Get inventory report of servers" }, { "customStatus": "False", "displayName": "Threshold Details of Devices", "isCustom": "false", "id": 150, "url": "/reports/GenerateReports.do?firstTime=true&reportID=150", "Name": "webclient.report.name.thresholdreports", "desc": "Get report of all thresholds configured" }, { "customStatus": "True", "displayName": "All Devices", "isCustom": "true", "id": 76, "url": "/reports/GenerateReports.do?firstTime=true&reportID=76", "Name": "All Devices", "desc": "Get inventory report of all devices" }, { "customStatus": "False", "displayName": "Interfaces by Type", "isCustom": "false", "id": 75, "url": "/reports/GenerateReports.do?firstTime=true&reportID=75", "Name": "Interfaces by Type", "desc": "Get report of all interfaces by type" }, { "customStatus": "False", "displayName": "Interface Speed Report", "isCustom": "false", "id": 74, "url": "/reports/GenerateReports.do?firstTime=true&reportID=74", "Name": "Interface Speed Report", "desc": "Get report of interface bandwidth" }, { "customStatus": "False", "displayName": "Notification Profiles Applied by Device", "isCustom": "false", "id": 73, "url": "/reports/GenerateReports.do?firstTime=true&reportID=73", "Name": "Notification Profiles Applied by Device", "desc": "Get report of all notification profiles applied by device" }, { "customStatus": "False", "displayName": "Devices by Added Time", "isCustom": "false", "id": 725, "url": "/reports/GenerateReports.do?firstTime=true&reportID=725", "Name": "Devices by Added Time", "desc": "Get Devices with its Added Time" }, { "customStatus": "False", "displayName": "Uplink Dependency Devices", "isCustom": "false", "id": 727, "url": "/reports/GenerateReports.do?firstTime=true&reportID=727", "Name": "Up Link Dependency Devices", "desc": "Get inventory report of all dependent devices" }, { "customStatus": "False", "displayName": "Credentials Associated Devices", "isCustom": "false", "id": 761, "url": "/reports/GenerateReports.do?firstTime=true&reportID=761", "Name": "webclient.credential.devices.report", "desc": "Get report of credentials associated to devices" }, { "customStatus": "False", "displayName": "Agent-monitored devices", "isCustom": "false", "id": 862, "url": "/reports/GenerateReports.do?firstTime=true&reportID=862", "Name": "Agent Devices", "desc": "Get an Inventory report of all agent-monitored devices" }, { "customStatus": "False", "displayName": "IPMI Information", "isCustom": "false", "id": 723, "url": "/reports/GenerateReports.do?firstTime=true&reportID=723", "Name": "webclient.reports.ipmi.info.title", "desc": "Get a report of your IPMI devices and related hardware" } ], "title": "" } ], "Name": "Inventory" }, { "displayName": "WAN RTT Monitors", "list": [ { "list": [ { "customStatus": "False", "displayName": "Top N Paths with Maximum RTT", "isCustom": "false", "id": 101, "url": "/reports/GenerateReports.do?firstTime=true&reportID=101", "Name": "Top N Paths with Maximum RTT", "desc": "Top paths with maximum Round Trip Time" }, { "customStatus": "False", "displayName": "Round Trip Time History Report", "isCustom": "false", "id": 97, "url": "/reports/GenerateReports.do?firstTime=true&reportID=97", "Name": "Round Trip Time Trend Report", "desc": "Show RTT of icmp packets between source and destination host" }, { "customStatus": "False", "displayName": "Availability History", "isCustom": "false", "id": 98, "url": "/reports/GenerateReports.do?firstTime=true&reportID=98", "Name": "Link Availability and Error Statistics", "desc": "Show availability of destination also show type of errors in case of failed operation" }, { "customStatus": "False", "displayName": "RTT Threshold Violation Report", "isCustom": "false", "id": 96, "url": "/reports/GenerateReports.do?firstTime=true&reportID=96", "Name": "RTT Threshold Violation Report", "desc": "Shows threshold violation of icmp packets between source and destination host" }, { "customStatus": "False", "displayName": "Top N Least Available Paths", "isCustom": "false", "id": 99, "url": "/reports/GenerateReports.do?firstTime=true&reportID=99", "Name": "Top N Least Available Paths", "desc": "Top paths with least availability" }, { "customStatus": "False", "displayName": "Top N Paths with Maximum Threshold Violation", "isCustom": "false", "id": 100, "url": "/reports/GenerateReports.do?firstTime=true&reportID=100", "Name": "Top N Paths with Maximum Threshold Violation", "desc": "Top paths with maximum threshold violation" } ], "title": "" } ], "Name": "WAN RTT Monitors" }, { "displayName": "VoIP Monitors", "list": [ { "list": [ { "customStatus": "False", "displayName": "Round Trip Time History Report", "isCustom": "false", "id": 107, "url": "/reports/GenerateReports.do?firstTime=true&reportID=107", "Name": "Round Trip Time History Report", "desc": "Shows RTT (Round Trip Time) of VoIP packets in both directions" }, { "customStatus": "False", "displayName": "Top N Call Paths by Jitter", "isCustom": "false", "id": 110, "url": "/reports/GenerateReports.do?firstTime=true&reportID=110", "Name": "Top N Call Paths by Jitter", "desc": "Top call paths with maximum Jitter" }, { "customStatus": "False", "displayName": "Top N Call Paths by Packet Loss", "isCustom": "false", "id": 109, "url": "/reports/GenerateReports.do?firstTime=true&reportID=109", "Name": "Top N Call Paths by Packet Loss", "desc": "Top call paths with maximum Packet Loss" }, { "customStatus": "False", "displayName": "Top N Call Paths by MOS", "isCustom": "false", "id": 108, "url": "/reports/GenerateReports.do?firstTime=true&reportID=108", "Name": "Top N Call Paths by MOS", "desc": "Top call paths with minimum MOS" }, { "customStatus": "False", "displayName": "Top N Call Paths by Latency", "isCustom": "false", "id": 111, "url": "/reports/GenerateReports.do?firstTime=true&reportID=111", "Name": "Top N Call Paths by Latency", "desc": "Top call paths with maximum Latency" }, { "customStatus": "False", "displayName": "Latency History Report", "isCustom": "false", "id": 102, "url": "/reports/GenerateReports.do?firstTime=true&reportID=102", "Name": "Latency History Report", "desc": "Shows latency of VoIP packets in both directions" }, { "customStatus": "False", "displayName": "Jitter History Report", "isCustom": "false", "id": 103, "url": "/reports/GenerateReports.do?firstTime=true&reportID=103", "Name": "Jitter History Report", "desc": "Shows jitter (inter packet delay) of VoIP packets in bonfa.overview.Qos=QoS" }, { "customStatus": "False", "displayName": "Packet Loss History Report", "isCustom": "false", "id": 104, "url": "/reports/GenerateReports.do?firstTime=true&reportID=104", "Name": "Packet Loss History Report", "desc": "Shows packetloss of VoIP packets in both directions" }, { "customStatus": "False", "displayName": "VoIP Errors History Report", "isCustom": "false", "id": 105, "url": "/reports/GenerateReports.do?firstTime=true&reportID=105", "Name": "VoIP Errors History Report", "desc": "Shows various errors (timeout, tail drop,MIA etc.,) generated in the VoIP traffic" }, { "customStatus": "False", "displayName": "MOS History Report", "isCustom": "false", "id": 106, "url": "/reports/GenerateReports.do?firstTime=true&reportID=106", "Name": "MOS History Report", "desc": "Report shows MOS (Mean Opinion Score) of VoIP traffic. MOS is the key quality indicator of VoIP traffic" } ], "title": "" } ], "Name": "VoIP Monitors" }, { "displayName": "Virtual Servers Report", "list": [ { "list": [ { "customStatus": "False", "displayName": "HyperV-Host vs Disk Mapping", "isCustom": "false", "id": 154, "url": "/reports/GenerateReports.do?firstTime=true&reportID=154", "Name": "webclient.virtual.hyperv.hostdisk.report", "desc": "Get report for all Monitored HyperV-Host Vs Disk Mappings" }, { "customStatus": "False", "displayName": "Datastore vs VMware-Host Mapping", "isCustom": "false", "id": 153, "url": "/reports/GenerateReports.do?firstTime=true&reportID=153", "Name": "webclient.virtual.vmware.datastorehost.report", "desc": "Get report for all Datastore Vs Monitored VMware-Host Mappings" }, { "customStatus": "False", "displayName": "Datastore vs VMware-VM Mapping", "isCustom": "false", "id": 152, "url": "/reports/GenerateReports.do?firstTime=true&reportID=152", "Name": "webclient.virtual.vmware.datastorevm.report", "desc": "Get report for all Datastore Vs Monitored VMware-VM Mappings" }, { "customStatus": "False", "displayName": "VMware Idle VMs", "isCustom": "false", "id": 156, "url": "/reports/GenerateReports.do?firstTime=true&reportID=156", "Name": "widget.name.vmware.idleVms", "desc": "List of Idle VMs" }, { "customStatus": "False", "displayName": "Top VMware VMs by CPU Under Allocated", "isCustom": "false", "id": 157, "url": "/reports/GenerateReports.do?firstTime=true&reportID=157", "Name": "widget.name.vmware.vmUnderAllocatedCPU", "desc": "vms with under allocated CPU" }, { "customStatus": "False", "displayName": "Top VMware VMs by CPU Over Allocated", "isCustom": "false", "id": 158, "url": "/reports/GenerateReports.do?firstTime=true&reportID=158", "Name": "widget.name.vmware.vmOverAllocatedCPU", "desc": "VMs with CPU over allocated" }, { "customStatus": "False", "displayName": "Top VMware VMs by Memory Under Allocated", "isCustom": "false", "id": 159, "url": "/reports/GenerateReports.do?firstTime=true&reportID=159", "Name": "widget.name.vmware.vmUnderAllocatedMemory", "desc": "VMs with memory under allocated" }, { "customStatus": "False", "displayName": "Top VMware VMs by Memory Over Allocated", "isCustom": "false", "id": 160, "url": "/reports/GenerateReports.do?firstTime=true&reportID=160", "Name": "widget.name.vmware.vmOverAllocatedMemory", "desc": "VMs with memory over allocated" }, { "customStatus": "False", "displayName": "All Virtual Machines", "isCustom": "false", "id": 726, "url": "/reports/GenerateReports.do?firstTime=true&reportID=726", "Name": "widget.name.vmware.vmsList", "desc": "List of virtual machines based on virtual type" } ], "title": "" } ], "Name": "Virtual Servers Report" }, { "displayName": "Storage Reports", "list": [ { "list": [ { "customStatus": "False", "displayName": "Growth Trend", "isCustom": "false", "id": 174, "url": "/reports/GenerateReports.do?firstTime=true&reportID=174", "Name": "webclient.reports.growthtrend.title", "desc": "Growth Trend" }, { "customStatus": "False", "displayName": "Storage Summary", "isCustom": "false", "id": 161, "url": "/reports/GenerateReports.do?firstTime=true&reportID=161", "Name": "webclient.reports.storagesummary.title", "desc": "Storage Summary" }, { "customStatus": "False", "displayName": "RAID Capacity Utilization", "isCustom": "false", "id": 162, "url": "/reports/GenerateReports.do?firstTime=true&reportID=162", "Name": "webclient.reports.topncapacity", "desc": "RAID Capacity Utilization" }, { "customStatus": "False", "displayName": "RAID IOPS ", "isCustom": "false", "id": 163, "url": "/reports/GenerateReports.do?firstTime=true&reportID=163", "Name": "webclient.reports.topnraidiops", "desc": "RAID IOPS " }, { "customStatus": "False", "displayName": "RAID Reads/Sec", "isCustom": "false", "id": 164, "url": "/reports/GenerateReports.do?firstTime=true&reportID=164", "Name": "webclient.reports.topnraidreads", "desc": "RAID Reads/Sec" }, { "customStatus": "False", "displayName": "RAID Writes/Sec", "isCustom": "false", "id": 165, "url": "/reports/GenerateReports.do?firstTime=true&reportID=165", "Name": "webclient.reports.topnraidwrites", "desc": "RAID Writes/Sec" }, { "customStatus": "False", "displayName": "RAID Latency", "isCustom": "false", "id": 166, "url": "/reports/GenerateReports.do?firstTime=true&reportID=166", "Name": "webclient.reports.topnraidlatency", "desc": "RAID Latency" }, { "customStatus": "False", "displayName": "RAID Controller IOPS", "isCustom": "false", "id": 167, "url": "/reports/GenerateReports.do?firstTime=true&reportID=167", "Name": "webclient.reports.topnraidcontrolleriops", "desc": "RAID Controller IOPS" }, { "customStatus": "False", "displayName": "RAID Controller Reads/Sec", "isCustom": "false", "id": 168, "url": "/reports/GenerateReports.do?firstTime=true&reportID=168", "Name": "webclient.reports.topnraidcontrollerreads", "desc": "RAID Controller Reads/Sec" }, { "customStatus": "False", "displayName": "RAID Controller Writes/Sec", "isCustom": "false", "id": 169, "url": "/reports/GenerateReports.do?firstTime=true&reportID=169", "Name": "webclient.reports.topnraidcontrollerwrites", "desc": "RAID Controller Writes/Sec" }, { "customStatus": "False", "displayName": "Disk IOPS", "isCustom": "false", "id": 170, "url": "/reports/GenerateReports.do?firstTime=true&reportID=170", "Name": "webclient.reports.topndiskiops", "desc": "Disk IOPS" }, { "customStatus": "False", "displayName": "Disk Reads/Sec", "isCustom": "false", "id": 171, "url": "/reports/GenerateReports.do?firstTime=true&reportID=171", "Name": "webclient.reports.topndiskreads", "desc": "Disk Reads/Sec" }, { "customStatus": "False", "displayName": "Disk Writes/Sec", "isCustom": "false", "id": 172, "url": "/reports/GenerateReports.do?firstTime=true&reportID=172", "Name": "webclient.reports.topndiskwrites", "desc": "Disk Writes/Sec" }, { "customStatus": "False", "displayName": "RAID Forecast By Utilization", "isCustom": "false", "id": 173, "url": "/reports/GenerateReports.do?firstTime=true&reportID=173", "Name": "webclient.reports.forecast.title", "desc": "RAID Forecast By Utilization" } ], "title": "" } ], "Name": "Storage Reports" }, { "displayName": "Forecast Reports", "list": [ { "list": [ { "customStatus": "False", "displayName": "Memory Forecast", "isCustom": "false", "id": 177, "url": "/reports/GenerateReports.do?firstTime=true&reportID=177", "Name": "Memory Forecast", "desc": "Forecasts the Memory Utilization" }, { "customStatus": "False", "displayName": "Disk Forecast By Usage", "isCustom": "false", "id": 175, "url": "/reports/GenerateReports.do?firstTime=true&reportID=175", "Name": "Disk Forecast By Usage", "desc": "Disk Forecast By Usage" }, { "customStatus": "False", "displayName": "CPU Forecast", "isCustom": "false", "id": 178, "url": "/reports/GenerateReports.do?firstTime=true&reportID=178", "Name": "CPU Forecast", "desc": "Forecasts the CPU utilization" } ], "title": "" } ], "Name": "Forecast Reports" }, { "displayName": "Nutanix Reports", "list": [ { "list": [ { "customStatus": "False", "displayName": "Top N Hosts by IOPS", "isCustom": "false", "id": 740, "url": "/reports/GenerateReports.do?firstTime=true&reportID=740", "Name": "webclient.nutanix.hostsUnderIOPS.report", "desc": "Get report for Top Hosts with IOPS rate" }, { "customStatus": "False", "displayName": "Disk Inventory", "isCustom": "false", "id": 739, "url": "/reports/GenerateReports.do?firstTime=true&reportID=739", "Name": "webclient.nutanix.disk.report", "desc": "Get report for all Disk Inventory Details" }, { "customStatus": "False", "displayName": "Storage Containers", "isCustom": "false", "id": 738, "url": "/reports/GenerateReports.do?firstTime=true&reportID=738", "Name": "webclient.nutanix.storagecontainers", "desc": "Get report for all Storage Container Details" }, { "customStatus": "False", "displayName": "Cluster Latency", "isCustom": "false", "id": 736, "url": "/reports/GenerateReports.do?firstTime=true&reportID=736", "Name": "webclient.nutanix.cluster.latency.report", "desc": "Get report for all Cluster Latency Data" }, { "customStatus": "False", "displayName": "Cluster IOPS", "isCustom": "false", "id": 735, "url": "/reports/GenerateReports.do?firstTime=true&reportID=735", "Name": "webclient.nutanix.cluster.iops.report", "desc": "Get report for all Cluster IOPS Data" }, { "customStatus": "False", "displayName": "Cluster Inventory", "isCustom": "false", "id": 734, "url": "/reports/GenerateReports.do?firstTime=true&reportID=734", "Name": "webclient.nutanix.cluster.report", "desc": "Get report for all Cluster details" }, { "customStatus": "False", "displayName": "VM Summary by Host", "isCustom": "false", "id": 733, "url": "/reports/GenerateReports.do?firstTime=true&reportID=733", "Name": "webclient.nutanix.hostToVmMap.report", "desc": "Get report for VMs Details based on its Host" }, { "customStatus": "False", "displayName": "VM Summary by Cluster", "isCustom": "false", "id": 732, "url": "/reports/GenerateReports.do?firstTime=true&reportID=732", "Name": "webclient.nutanix.clusterToVMMap.report", "desc": "Get report for VM Details based on its Cluster" }, { "customStatus": "False", "displayName": "Host Summary", "isCustom": "false", "id": 737, "url": "/reports/GenerateReports.do?firstTime=true&reportID=737", "Name": "webclient.nutanix.clusterToHostMap.report", "desc": "Get report for all Host Details based on its Cluster" }, { "customStatus": "False", "displayName": "Top N Hosts by IO Bandwidth", "isCustom": "false", "id": 743, "url": "/reports/GenerateReports.do?firstTime=true&reportID=743", "Name": "webclient.nutanix.hostUnderBandwidth.report", "desc": "Get report for Top Disks with IO Bandwidth rate" }, { "customStatus": "False", "displayName": "Top N Hosts by Latency", "isCustom": "false", "id": 742, "url": "/reports/GenerateReports.do?firstTime=true&reportID=742", "Name": "webclient.nutanix.hostUnderLatency.report", "desc": "Get report for Top Hosts with Latency" }, { "customStatus": "False", "displayName": "Top N Disks by free space", "isCustom": "false", "id": 741, "url": "/reports/GenerateReports.do?firstTime=true&reportID=741", "Name": "webclient.nutanix.diskUnderFreespace.report", "desc": "Get report for Top Disks with Free space" } ], "title": "" } ], "Name": "Nutanix Reports" }, { "displayName": "WLC Reports", "list": [ { "list": [ { "customStatus": "False", "displayName": "AP Availability", "isCustom": "false", "id": 837, "url": "/reports/GenerateReports.do?firstTime=true&reportID=837", "Name": "webclient.availability.accessPoints.report", "desc": "Get availability report for Access points" }, { "customStatus": "False", "displayName": "Rogue SSID Details", "isCustom": "false", "id": 839, "url": "/reports/GenerateReports.do?firstTime=true&reportID=839", "Name": "webclient.inventory.RougeAP.report", "desc": "Get inventory report of Rogue SSIDs" }, { "customStatus": "False", "displayName": "AP Details", "isCustom": "false", "id": 838, "url": "/reports/GenerateReports.do?firstTime=true&reportID=838", "Name": "webclient.inventory.accessPoints.report", "desc": "Get inventory report of Access points" } ], "title": "" } ], "Name": "WLC Reports" }, { "displayName": "Meraki Reports", "list": [ { "list": [ { "customStatus": "False", "displayName": "Meraki MS Details", "isCustom": "false", "id": 855, "url": "/reports/GenerateReports.do?firstTime=true&reportID=855", "Name": "webclient.opm.reports.meraki.msdetails", "desc": "Get summary reports of Meraki Switch devices." }, { "customStatus": "False", "displayName": "Meraki AP Details", "isCustom": "false", "id": 860, "url": "/reports/GenerateReports.do?firstTime=true&reportID=860", "Name": "webclient.opm.reports.meraki.apDetails", "desc": "Get inventory reports of Meraki Access Points." }, { "customStatus": "False", "displayName": "Meraki Rogue SSID Details", "isCustom": "false", "id": 859, "url": "/reports/GenerateReports.do?firstTime=true&reportID=859", "Name": "webclient.opm.reports.meraki.rogue", "desc": "Get inventory reports of Meraki Rogue SSIDs." }, { "customStatus": "False", "displayName": "Meraki Cellular Gateway Details", "isCustom": "false", "id": 858, "url": "/reports/GenerateReports.do?firstTime=true&reportID=858", "Name": "webclient.opm.reports.meraki.mgdetails", "desc": "Get summary reports of Meraki Gateway devices." }, { "customStatus": "False", "displayName": "Meraki MV Details", "isCustom": "false", "id": 857, "url": "/reports/GenerateReports.do?firstTime=true&reportID=857", "Name": "webclient.opm.reports.meraki.mvdetails", "desc": "Get summary reports of Meraki Vision devices." }, { "customStatus": "False", "displayName": "Meraki MR Details", "isCustom": "false", "id": 856, "url": "/reports/GenerateReports.do?firstTime=true&reportID=856", "Name": "webclient.opm.reports.meraki.mrdetails", "desc": "Get summary reports of Meraki Radio devices." }, { "customStatus": "False", "displayName": "Meraki Organization Summary", "isCustom": "false", "id": 853, "url": "/reports/GenerateReports.do?firstTime=true&reportID=853", "Name": "webclient.opm.reports.meraki.orgSummary", "desc": "Get inventory reports of devices in each organization" }, { "customStatus": "False", "displayName": "Meraki MX Details", "isCustom": "false", "id": 854, "url": "/reports/GenerateReports.do?firstTime=true&reportID=854", "Name": "webclient.opm.reports.meraki.mxdetails", "desc": "Get summary reports of Meraki Security appliances." }, { "customStatus": "False", "displayName": "Down Meraki Devices", "isCustom": "false", "id": 861, "url": "/reports/GenerateReports.do?firstTime=true&reportID=861", "Name": "webclient.opm.reports.meraki.down", "desc": "Get reports for all Meraki devices that are down." } ], "title": "" } ], "Name": "Meraki Reports" }, { "displayName": "My Favorites", "list": [ { "list": [ { "customStatus": "False", "displayName": "All Alerts", "isCustom": "false", "id": 84, "isFavourite": "True", "url": "/reports/GenerateReports.do?firstTime=true&reportID=84", "Name": "All Alerts", "desc": "Get report for all alerts" }, { "customStatus": "False", "displayName": "All Events", "isCustom": "false", "id": 1, "isFavourite": "True", "url": "/reports/GenerateReports.do?firstTime=true&reportID=1", "Name": "All Events", "desc": "Get report for all events" }, { "customStatus": "False", "displayName": "WAN Links by Utilization", "isCustom": "false", "id": 15, "isFavourite": "True", "url": "/reports/GenerateReports.do?firstTime=true&reportID=15", "Name": "WAN Links by Utilization", "desc": "Identify WAN links with heavy traffic utilization" }, { "customStatus": "True", "displayName": "Servers Health Report", "isCustom": "true", "id": 22, "isFavourite": "True", "url": "/reports/GenerateReports.do?firstTime=true&reportID=22", "Name": "Servers Health Report", "desc": "Get health report of servers" }, { "customStatus": "False", "displayName": "WAN Links Availability", "isCustom": "false", "id": 54, "isFavourite": "True", "url": "/reports/GenerateReports.do?firstTime=true&reportID=54", "Name": "WAN Links Availability", "desc": "Get availability report for all interfaces" }, { "customStatus": "False", "displayName": "All Interfaces Availability", "isCustom": "false", "id": 87, "isFavourite": "True", "url": "/reports/GenerateReports.do?firstTime=true&reportID=87", "Name": "All Interfaces Availability", "desc": "Get availability report for all interfaces" }, { "customStatus": "False", "displayName": "Service Monitors Availability", "isCustom": "false", "id": 56, "isFavourite": "True", "url": "/reports/GenerateReports.do?firstTime=true&reportID=56", "Name": "Service Monitors Availability", "desc": "Get availability report for all service monitors" }, { "customStatus": "False", "displayName": "Devices by Category", "isCustom": "false", "id": 70, "isFavourite": "True", "url": "/reports/GenerateReports.do?firstTime=true&reportID=70", "Name": "Devices by Category", "desc": "Get inventory report of devices by device category" } ], "title": "" } ], "Name": "My Favorites" }, { "ScheduleReports": true, "FavoriteReports": false, "CustomReports": true } ]
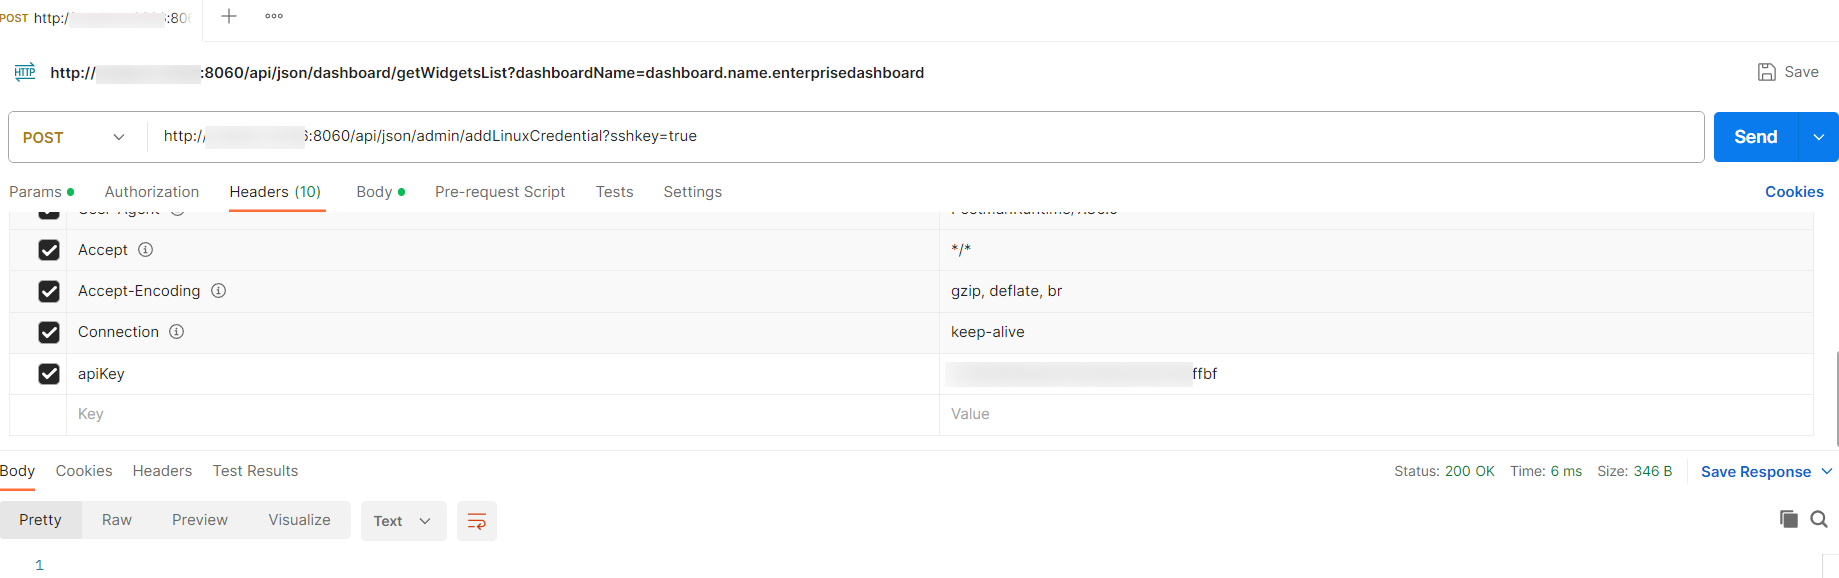
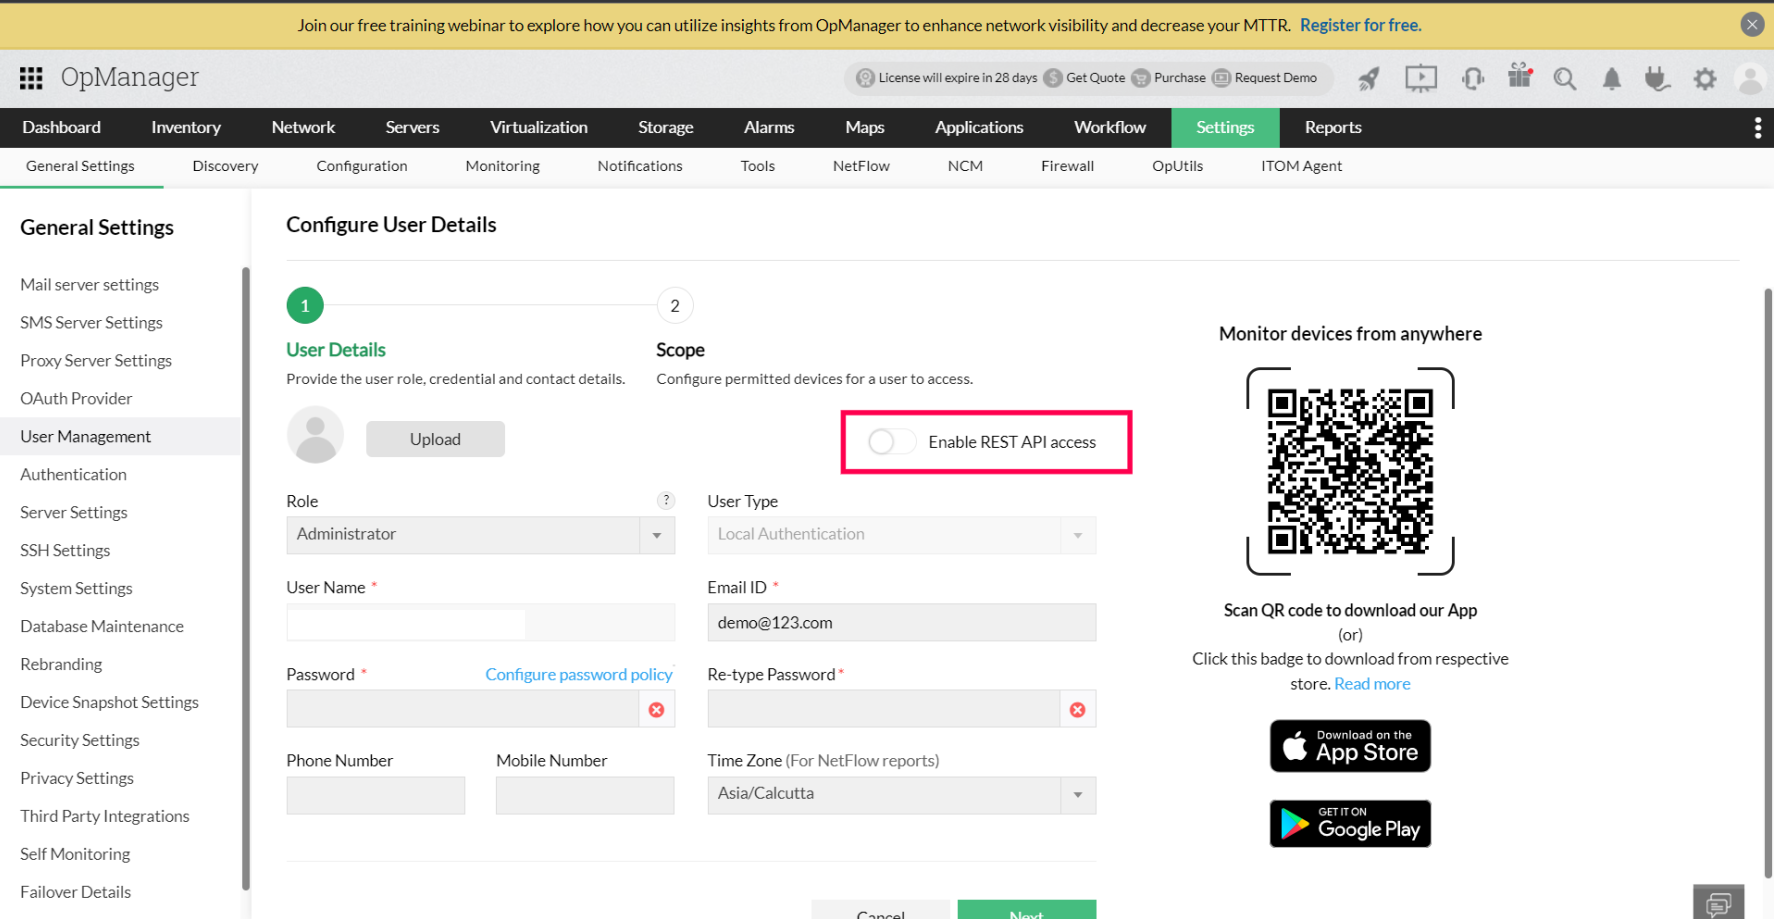
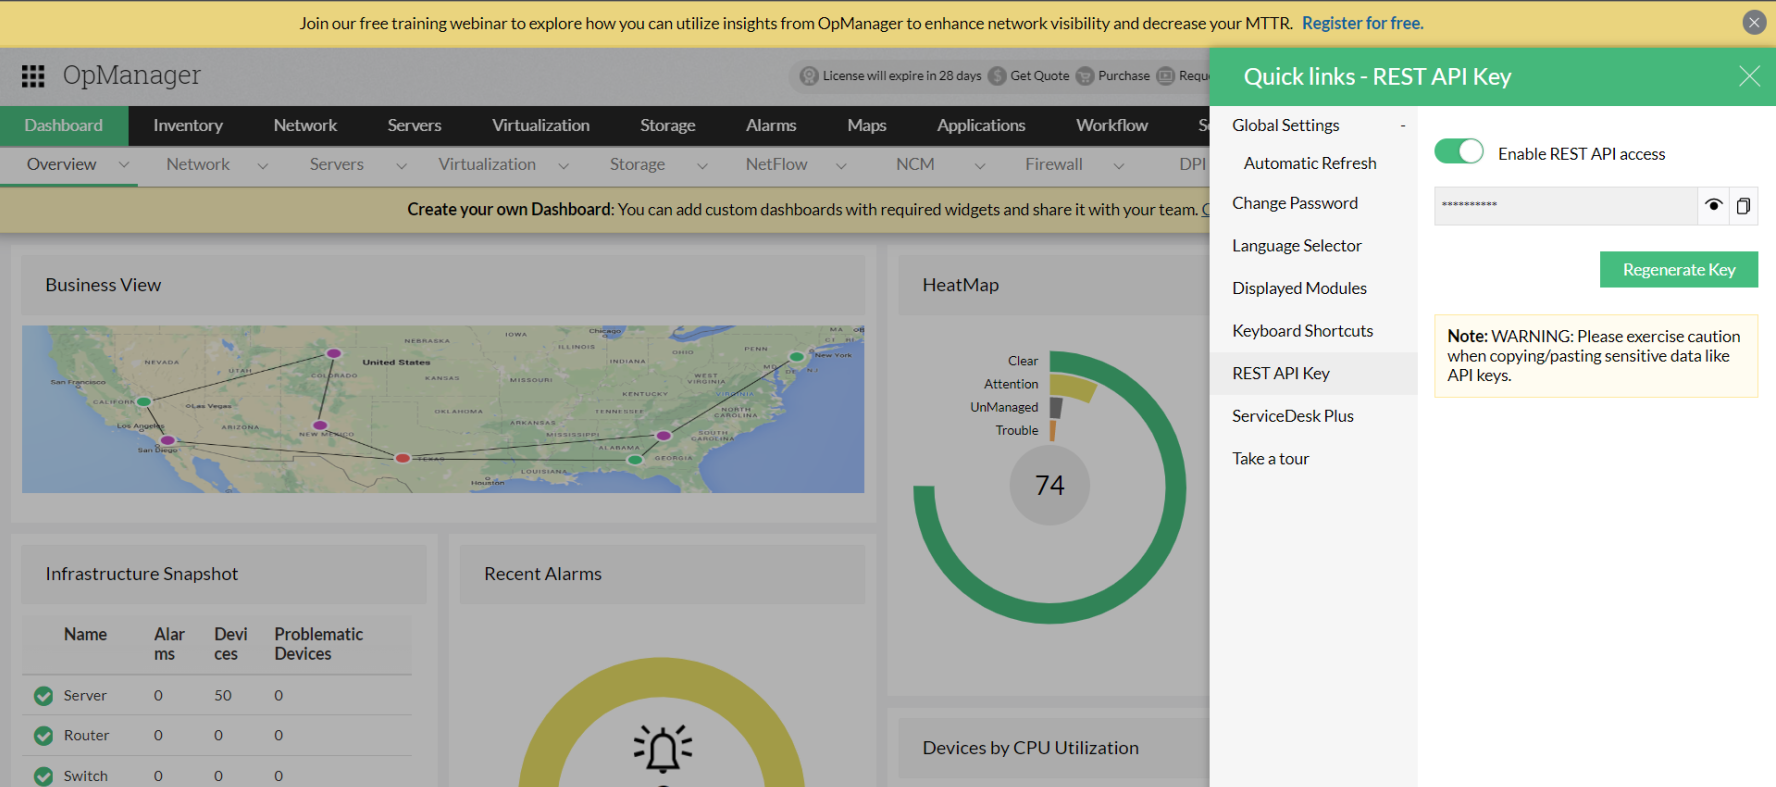
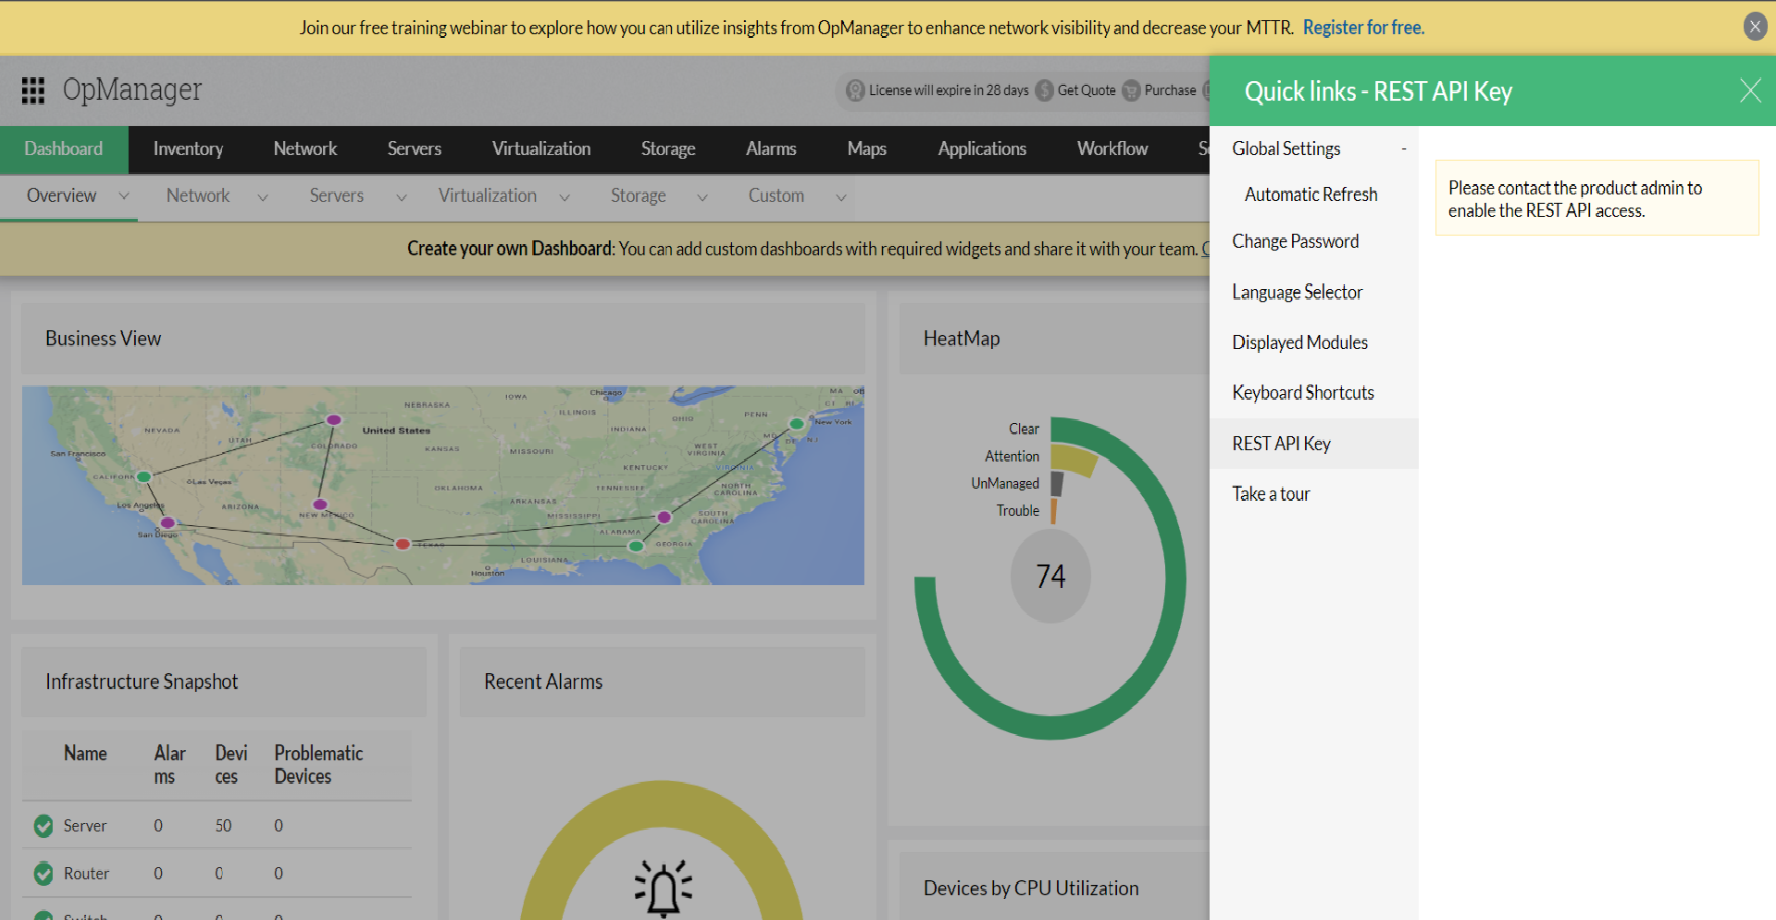
apiKey*
访问OpManager服务器的API密钥。
isFavouriteNeeded
布尔值显示收藏夹报表或不显示。
hideintegratedReports
布尔值以显示高级报表或不显示。
hideHardwareReport
是否显示硬件报表的布尔值。


 ","isSubInterface":"false","managed":"true","snapDetails":{"snapList":[{"indexCount":0,"ondemandWidget":false,"refresh":false,"type":"IntfSummary","sizex":10,"expand":false,"apiurl":"/client/api/json/device/getInterfaceSummary","rowNum":1,"parameter":"interfaceName","isEnabled":true,"colNum":1,"name":"opm.interface.summary","header":false,"id":10000000081,"snapid":10000000081,"snapshotData":{"EE_PROBE_REQ":"true"},"expandtime":false,"parameters":[],"sizey":12,"timeSelection":false,"desc":"dashboard.name.nwconfig"},{"indexCount":1,"ondemandWidget":false,"refresh":false,"type":"IntfGraphs","sizex":10,"expand":false,"apiurl":"/client/api/json/device/getInterfaceGraphs","rowNum":13,"parameter":"interfaceName","isEnabled":true,"colNum":1,"name":"opm.interface.graphs","header":true,"id":10000000082,"snapid":10000000082,"snapshotData":{"EE_PROBE_REQ":"true"},"expandtime":false,"parameters":[{"param":"graphName","paramData":[],"value":"totalPackets"},{"param":"isFluidic","paramData":[],"value":"true"},{"paramType":"opmtime","param":"period","paramData":[],"value":"Today"}],"sizey":13,"timeSelection":true,"desc":"webclient.devices.details.totalbytes"},{"indexCount":2,"ondemandWidget":false,"refresh":false,"type":"IntfGraphs","sizex":10,"expand":false,"apiurl":"/client/api/json/device/getInterfaceGraphs","rowNum":15,"parameter":"interfaceName","isEnabled":true,"colNum":1,"name":"opm.interface.graphs","header":true,"id":10000000083,"snapid":10000000083,"snapshotData":{"EE_PROBE_REQ":"true"},"expandtime":false,"parameters":[{"param":"graphName","paramData":[],"value":"traffic"},{"param":"isFluidic","paramData":[],"value":"true"},{"paramType":"opmtime","param":"period","paramData":[],"value":"Today"}],"sizey":13,"timeSelection":true,"desc":"webclient.snapshot.name.Interface.Traffic"},{"indexCount":3,"ondemandWidget":false,"refresh":false,"type":"IntfGraphs","sizex":10,"expand":false,"apiurl":"/client/api/json/device/getInterfaceGraphs","rowNum":17,"parameter":"interfaceName","isEnabled":true,"colNum":1,"name":"opm.interface.graphs","header":true,"id":10000000084,"snapid":10000000084,"snapshotData":{"EE_PROBE_REQ":"true"},"expandtime":false,"parameters":[{"param":"graphName","paramData":[],"value":"utilization"},{"param":"isFluidic","paramData":[],"value":"true"},{"paramType":"opmtime","param":"period","paramData":[],"value":"Today"}],"sizey":13,"timeSelection":true,"desc":"webclient.snapshot.name.Interface.Utilization"},{"indexCount":4,"ondemandWidget":false,"refresh":false,"type":"IntfGraphs","sizex":10,"expand":false,"apiurl":"/client/api/json/device/getInterfaceGraphs","rowNum":19,"parameter":"interfaceName","isEnabled":true,"colNum":1,"name":"opm.interface.graphs","header":true,"id":10000000085,"snapid":10000000085,"snapshotData":{"EE_PROBE_REQ":"true"},"expandtime":false,"parameters":[{"param":"graphName","paramData":[],"value":"errors"},{"param":"isFluidic","paramData":[],"value":"true"},{"paramType":"opmtime","param":"period","paramData":[],"value":"Today"}],"sizey":13,"timeSelection":true,"desc":"webclient.devices.details.errndiscards"},{"indexCount":5,"ondemandWidget":false,"refresh":false,"type":"IntfGraphs","sizex":10,"expand":false,"apiurl":"/client/api/json/device/getInterfaceGraphs","rowNum":21,"parameter":"interfaceName","isEnabled":true,"colNum":1,"name":"opm.interface.graphs","header":true,"id":10000000086,"snapid":10000000086,"snapshotData":{"EE_PROBE_REQ":"true"},"expandtime":false,"parameters":[{"param":"graphName","paramData":[],"value":"discardRate"},{"param":"isFluidic","paramData":[],"value":"true"},{"paramType":"opmtime","param":"period","paramData":[],"value":"Today"}],"sizey":13,"timeSelection":true,"desc":"webclient.snapshot.name.Discard.Rate"},{"indexCount":6,"ondemandWidget":false,"refresh":false,"type":"IntfGraphs","sizex":10,"expand":false,"apiurl":"/client/api/json/device/getInterfaceGraphs","rowNum":23,"parameter":"interfaceName","isEnabled":true,"colNum":1,"name":"opm.interface.graphs","header":true,"id":10000000087,"snapid":10000000087,"snapshotData":{"EE_PROBE_REQ":"true"},"expandtime":false,"parameters":[{"param":"graphName","paramData":[],"value":"packets"},{"param":"isFluidic","paramData":[],"value":"true"},{"paramType":"opmtime","param":"period","paramData":[],"value":"Today"}],"sizey":13,"timeSelection":true,"desc":"opu.views.PACKETS"},{"indexCount":7,"ondemandWidget":false,"refresh":false,"type":"IntfGraphs","sizex":10,"expand":false,"apiurl":"/client/api/json/device/getInterfaceGraphs","rowNum":25,"parameter":"interfaceName","isEnabled":true,"colNum":1,"name":"opm.interface.graphs","header":true,"id":10000000088,"snapid":10000000088,"snapshotData":{"EE_PROBE_REQ":"true"},"expandtime":false,"parameters":[{"param":"graphName","paramData":[],"value":"errorRate"},{"param":"isFluidic","paramData":[],"value":"true"},{"paramType":"opmtime","param":"period","paramData":[],"value":"Today"}],"sizey":13,"timeSelection":true,"desc":"webclient.snapshot.name.Error.Rate"},{"indexCount":8,"ondemandWidget":false,"refresh":false,"type":"Grid","sizex":10,"expand":false,"apiurl":"/client/api/json/device/getInterfaceMonitors","rowNum":50,"parameter":"interfaceName","isEnabled":true,"colNum":1,"name":"opm.interface.monitors","header":true,"id":10000000089,"snapid":10000000089,"snapshotData":{"colModelList":[{"name":"monitorName","index":"monitorName"},{"name":"interval","index":"interval"},{"name":"collectionTime","index":"collectionTime"},{"formatter":"intfValuesWithUnits","name":"value","index":"value"},{"hidden":true,"name":"displayName","index":"displayName"},{"hidden":true,"name":"unit","index":"unit"}],"colNamesList":["webclient.devices.details.monitors","webclient.map.edit.interval","webclient.devices.details.lastpoll","webclient.action.currVal","",""],"EE_PROBE_REQ":"true"},"expandtime":false,"parameters":[],"sizey":14,"timeSelection":false,"desc":"webclient.admin.url.monitors"},{"indexCount":9,"ondemandWidget":false,"refresh":false,"type":"Grid","sizex":10,"expand":false,"apiurl":"/client/api/json/device/getInterfaceMonitors","rowNum":50,"parameter":"interfaceName","isEnabled":true,"colNum":1,"name":"opm.interface.monitors","header":true,"id":10000000971,"snapid":10000000971,"snapshotData":{"colModelList":[{"name":"monitorName","index":"monitorName"},{"name":"interval","index":"interval"},{"name":"collectionTime","index":"collectionTime"},{"formatter":"intfValuesWithUnits","name":"value","index":"value"},{"hidden":true,"name":"displayName","index":"displayName"},{"hidden":true,"name":"unit","index":"unit"}],"colNamesList":["webclient.devices.details.monitors","webclient.map.edit.interval","webclient.devices.details.lastpoll","webclient.action.currVal","",""],"EE_PROBE_REQ":"true"},"expandtime":false,"parameters":[],"sizey":14,"timeSelection":false,"desc":"webclient.admin.url.monitors"},{"indexCount":10,"ondemandWidget":false,"refresh":false,"type":"Grid","sizex":10,"expand":false,"apiurl":"/client/api/json/device/getInterfaceNotes","rowNum":64,"parameter":"interfaceName","isEnabled":true,"colNum":1,"name":"opm.interface.notes","header":true,"id":10000000090,"snapid":10000000090,"snapshotData":{"colModelList":[{"hidden":true,"classes":"GridColHidden","name":"ALIASNAME","width":"0","index":"ALIASNAME","key":true},{"hidden":true,"classes":"GridColHidden","name":"DATATYPE","width":"0","index":"DATATYPE","key":true},{"formatter":"custField_escapeHtmlTags","name":"FIELDNAME","index":"FIELDNAME"},{"formatter":"custField_escapeHtmlTags","name":"DESCRIPTION","index":"DESCRIPTION"},{"formatter":"custField_escapeHtmlTags","name":"FIELDVALUE","index":"FIELDVALUE"}],"actionurls":[{"name":"Edit","url":"InterfaceNotes"}],"colNamesList":["","","webclient.devices.customfields.fieldname","webclient.devices.customfields.description","webclient.widget.value"]},"expandtime":false,"parameters":[],"sizey":14,"timeSelection":false,"desc":"webclient.commontext.customfields"}],"snapshotID":"10000000005","snapshotDesc":"snapshot.desc.Interface","snapshotName":"OPMInterface","tabs":{"tabs":[{"tabid":10000000026,"name":"webclient.snapshot.testlinks.summary","order":1},{"tabid":10000000027,"name":"webclient.snapshot.name.Interface.Graphs","order":2},{"tabid":10000000028,"name":"webclient.admin.url.monitors","order":3}],"tabWidgets":{"10000000028":[{"ROW":50,"ASSOCIATIONID":10000000089}],"10000000027":[{"ROW":13,"ASSOCIATIONID":10000000082},{"ROW":15,"ASSOCIATIONID":10000000083},{"ROW":17,"ASSOCIATIONID":10000000084},{"ROW":19,"ASSOCIATIONID":10000000085},{"ROW":21,"ASSOCIATIONID":10000000086},{"ROW":23,"ASSOCIATIONID":10000000087},{"ROW":25,"ASSOCIATIONID":10000000088}],"10000000026":[{"ROW":1,"ASSOCIATIONID":10000000081},{"ROW":64,"ASSOCIATIONID":10000000090}]}},"timeSelectionNeeded":true,"yScale":25,"maxColumns":10},"ifPhysAddr":"20","adminState":"Up","transBandwidth":"1","statusPolledVia":"SNMP","outSpeedDisplayValue":"1 bps","rstime":"1 bps","availabilityTimeLine":["ParentDown,1670178610981,1670233674317","ParentDown,1670234394000,1670234514150","UP,1670234514150,1670237050981","UP,1670233674317,1670234394000"],"rxPackets":"0.005 ","ifAdminStatus":"1","rxUtil":"0.89","ifSpeedIn":"1","isAddedToNFA":"false","Discards":"2","stringStatus":"Down","txPackets":"0.002 ","Errors":"2","ifSpeedOut":"1","inTraffic":"0.008 ","operState":"Up","intfmanaged":"true","name":"xxx.xxx.x.xx.10000000001","typeId":"6","ifOperStatus":"1","category":"Switch","adminStateImg":"
 Clear","NOOFNETWORKADAPTERS":1,"clusterName":"Nutanix-Cluster-1","hostMoName":"Nutanix-Host-1","MOID":307,"MEMRESERVEDCAPACITY":"6","ENTITYNAME":"Nutanix-VM-2"}