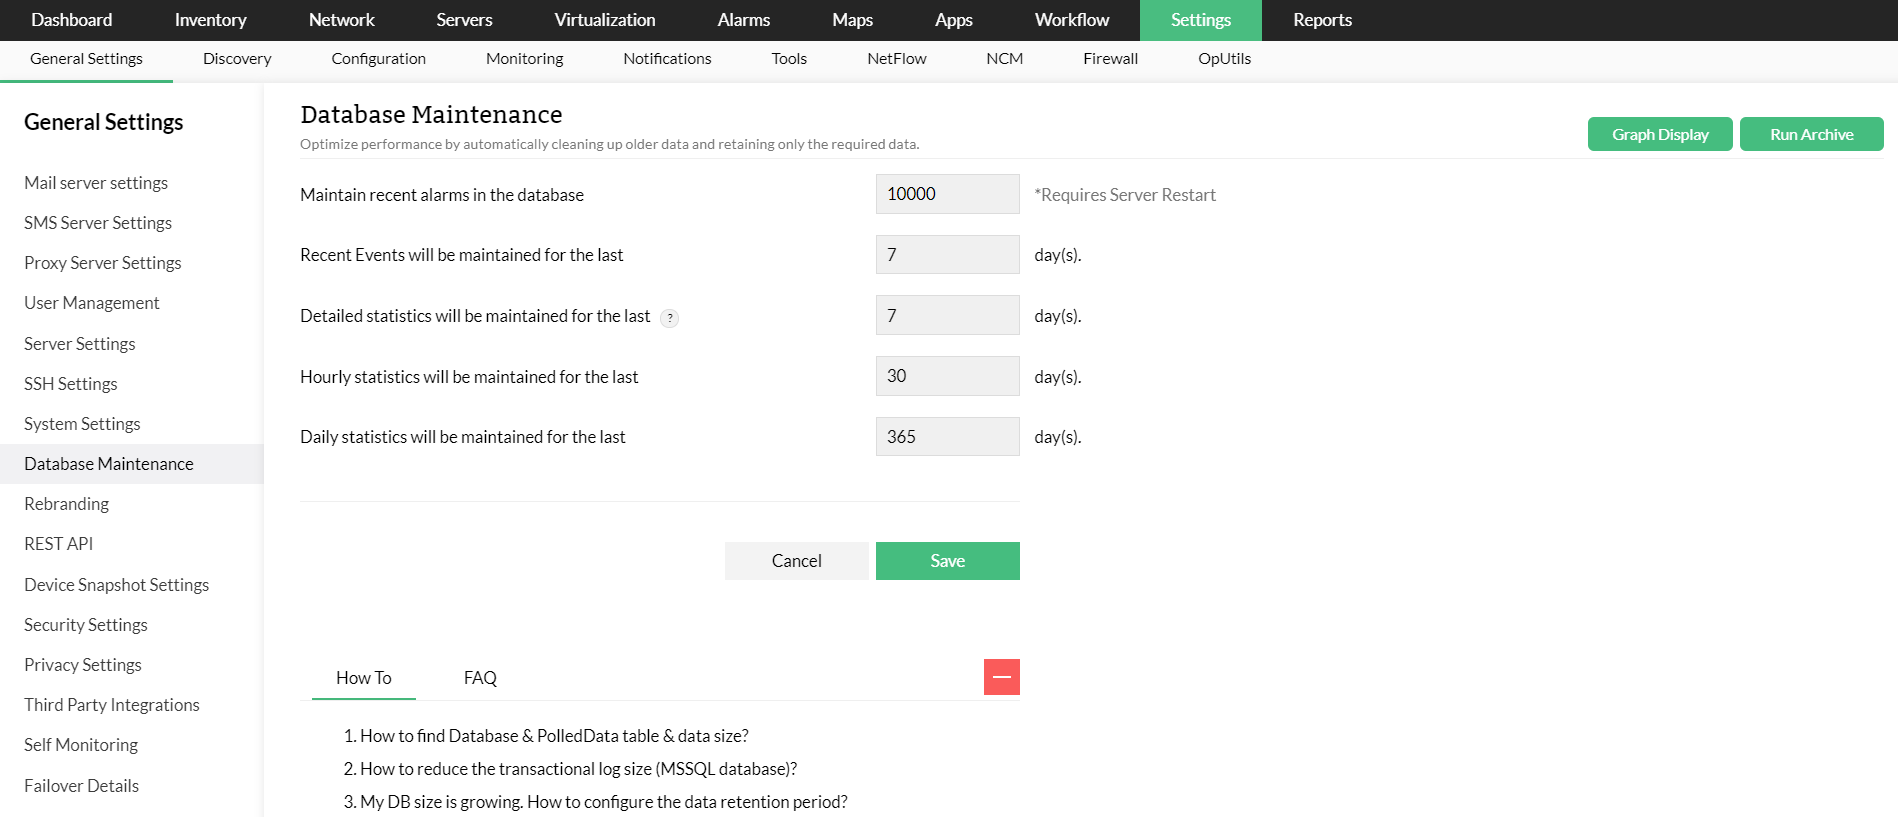
Following are some of the database operations that can be carried out with OpManager.
To effectively monitor the devices added to OpManager, and visualize their metrics in a user-friendly format, OpManager collects data from the managed devices at regular intervals. By default, OpManager collects the performance data as per the polling interval stored in a database and this is known as detailed statistics。 The data is then aggregated at hourly intervals and is known as hourly statistics。 The hourly data aggregated at daily intervals are known as daily statistics。 These aggregated data as well as the raw data will be used in graphs and reports.
The process of aggregating data at each stage and moving them to the subsequent tables is known as database archiving.
OpManager allows you to maintain the database with the required data. By default, the detailed data will be maintained for 7 days, the hourly data for 30 days and the daily data for 365 days. After the specified period, the database will be cleaned up automatically.
Database maintenance can be carried out by archiving the data and cleaning them up at regular intervals. Navigate to General 设置 -> 设置 -> Database maintenance to avail this feature and define the values suited to you. Once past the deadline, OpManager will remove the archaic statistics data.
The database size might vary based on a lot of factors such as number of monitors, number of instances in a monitor, polling interval, number of managed devices and interfaces etc. Hence it is of utmost importance to maintain your database. When the database maintenance values have been configured with higher values, more disk space might be required, thereby leading to performance-impacting issues. Kindly refer the below table for recommended values.
| Values | Raw data (Detailed data) | Hourly data | Daily data |
|---|---|---|---|
| Default Values(Days) | 7 | 30 | 365 |
| Recommended values(Days) | 15 | 90 | 3650 |
To configure your own settings for database maintenance, follow the steps given below:

To maintain the granularity/ accuracy of data in a graph, graph display settings can be configured accordingly. You can access the graph display settings by navigating to Database maintenance -> Run Archive -> Graph display settings。 The detailed, hourly and daily data limits give users some control over their desired granularity level of the graph. The graphs thus formed can be further studied to get insights into the performance of a device as well as an interface. To know more about graph display settings, kindly click here.
注意: The data used for displaying performance graphs will be controlled by both the Database Maintenance Settings and the Graph Display Settings。 It is recommended that the values provided in Graph Display Settings are less than the corresponding value in Database Maintenance settings to ensure graphs are displayed properly.
示例, let's say that the Detailed statistics retention time in the database maintenance is set to 15 days and the Detailed statistics retention limit in the Graph Display Settings is set to 6 days。 Then, the data fetched during the selected interval will be populated with detailed data points for days less than or equal to 6. For the rest of the days, the data will be populated with hourly data points.
A huge database with a lot of records will be difficult to maintain and interpret owing to its size. Hence database must be cleaned up periodically. The data will be cleaned up automatically based on the value configured under database maintenance.