Integrating with OpManager
Integrate with OpManager and generate detailed reports on alarms, business views, inventory, performance data and much more. Analytics Plus sources data from OpManager via its API using your login credentials.
Highlights of OpManager Integration
Analytics Plus offers out of the box reporting using data from the following modules:
Inventory: List of devices configured in OpManager
Alarms: This is a snapshot of the active alarms in OpManager
Alarms history: A history of alarms generated in OpManager
Business views: Details of the business views
Business views history: History of business view availability and health status
Performance details: Performance metrics of monitored devices
Get reports generated automatically with up-to-date data, set timeline filters and gain a complete overview of your network performance from module specific dashboards. For a full list of reports offered, click here.
Prerequisites
OpManager should be accessible from the server on which Analytics Plus is running. To verify this, try launching your OpManager web-client from the Analytics Plus server.
If both your applications (OpManager and Analytics Plus) are running on the same server, you don't have to worry about accessibility.
OpManager and Analytics Plus servers should be running in the same time zone.
The OpManager build should be 11600 or above.
- If you are running the 'Enterprise' edition of OpManager, the integration needs to be done on the Central Server.
Supported OpManager Editions
Essential
OpManager Plus
Enterprise
Steps to integrate
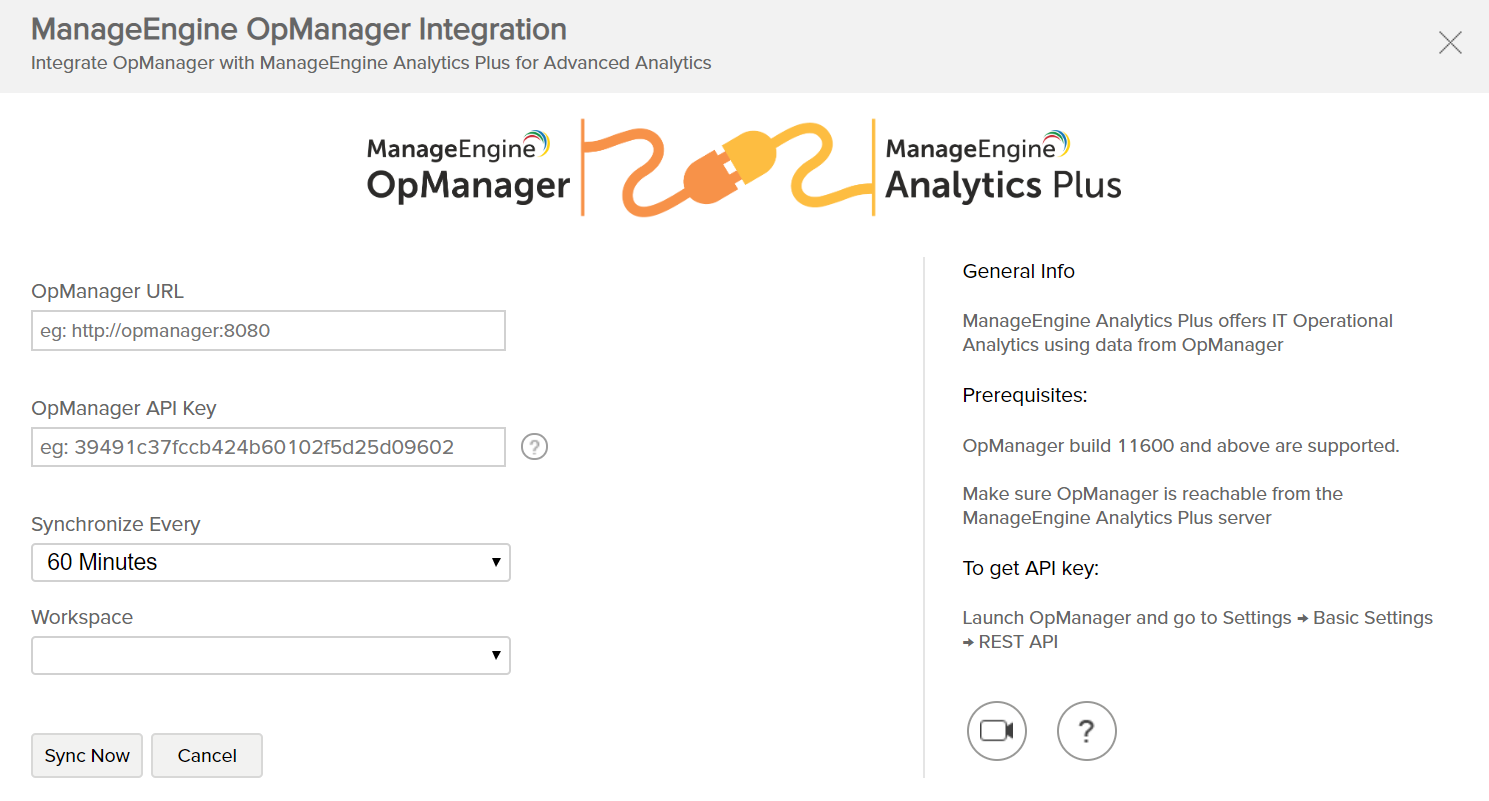
Step 1: Log into Analytics Plus and click on the OpManager tile under the Import your data section.

Step 2: In the pop-up screen:
Enter the OpManager web-client URL.
Enter the OpManager API key. The API key should be that of a user who has administrator privileges in OpManager.

Note:
How to generate API Key :
The User should log into OpManager with complete administrator privileges in order to generate the API key.
To generate an API key, go to Admin-> REST API in OpManager web client and click on Generate Key.
Choose the frequency of data synchronization between OpManager and Analytics Plus.
Click on the "Sync Now" button, to complete the Integration process.
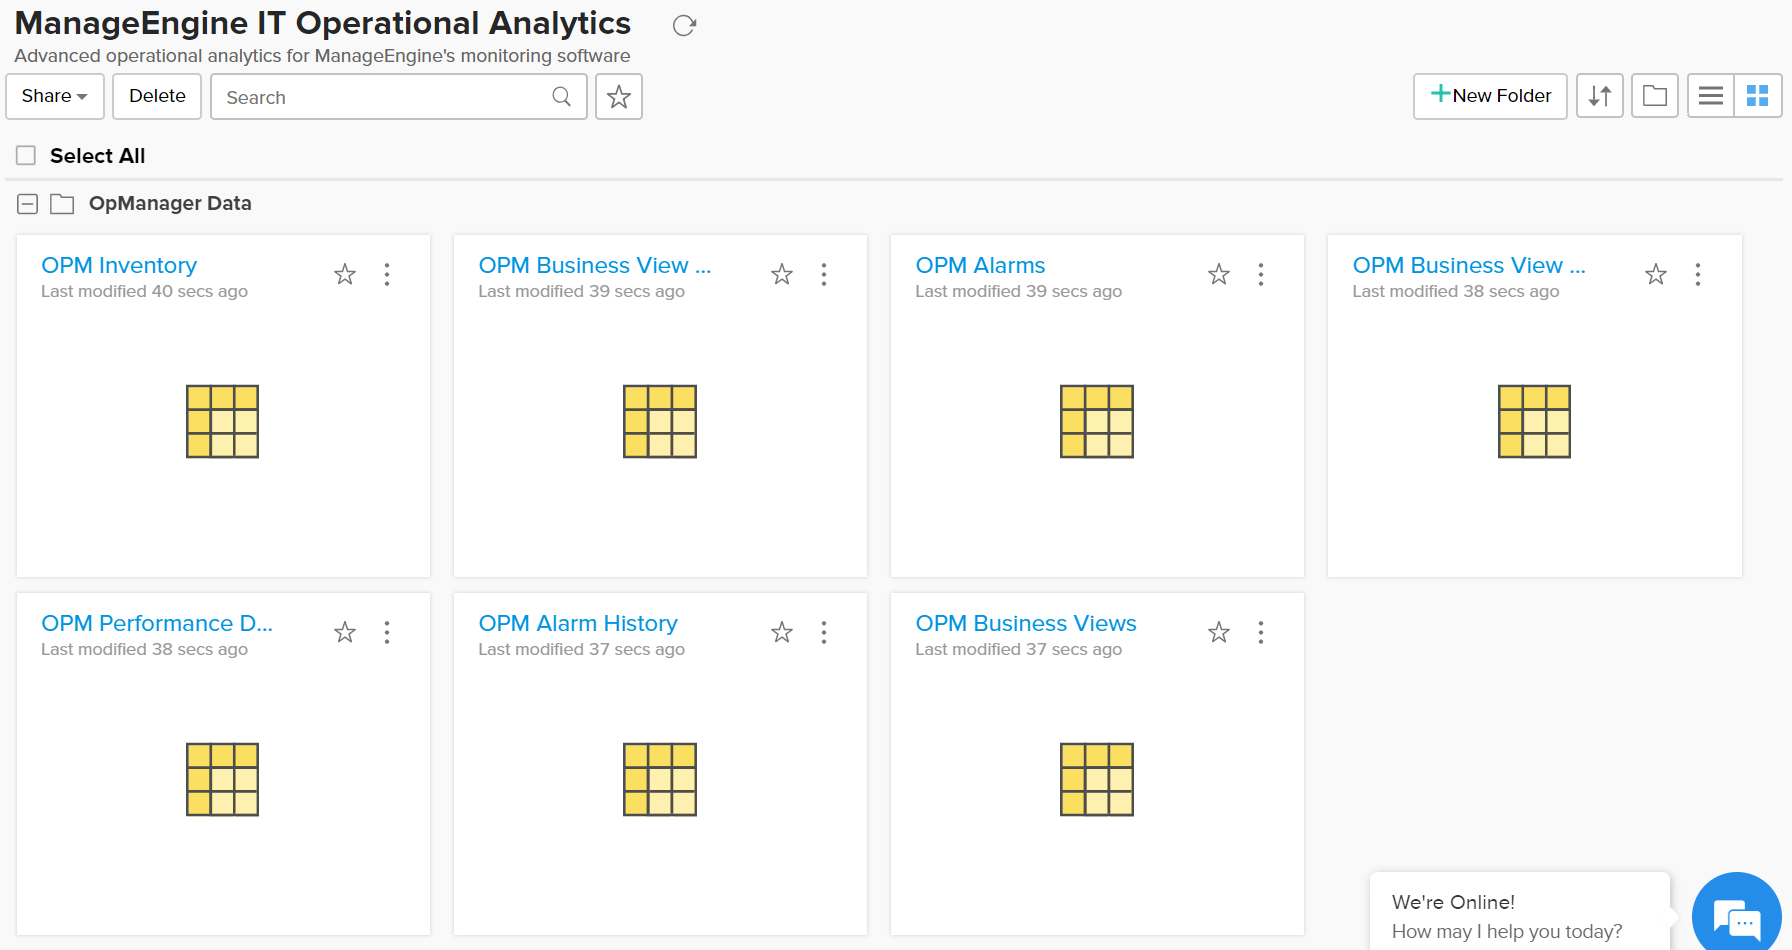
Step 3: On successful integration with OpManager, a workspace is created by the name "ManageEngine IT Operational Analytics".

Settings
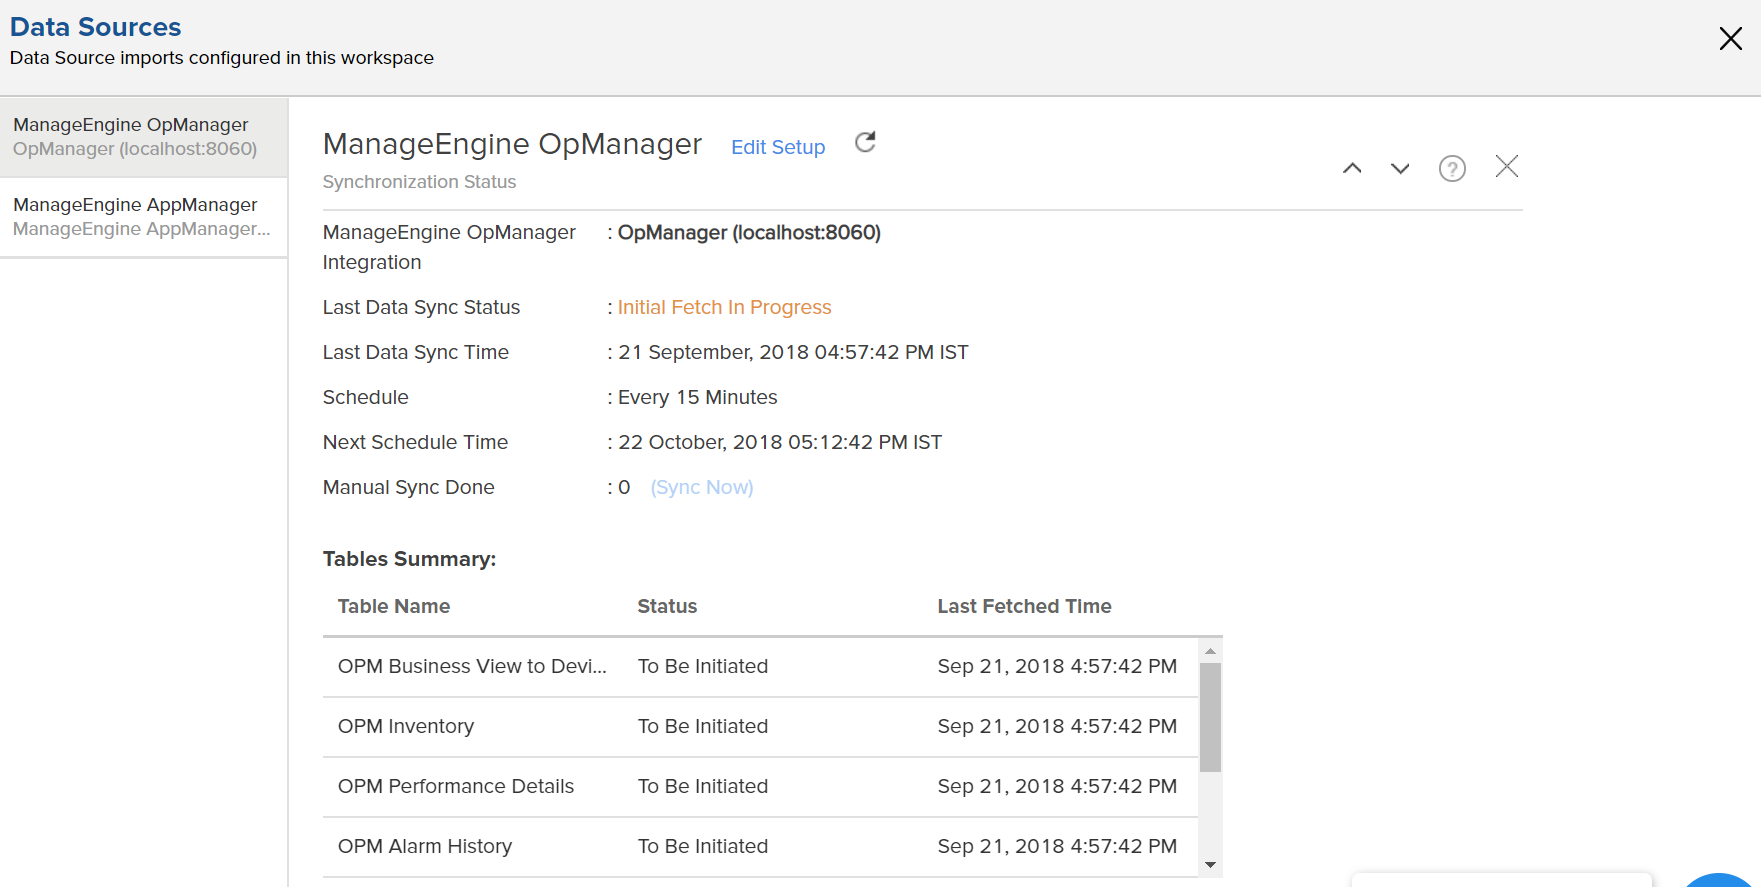
To edit the Integration Settings, click on the "ManageEngine OpManager" button that appears below the workspace name in the Explorer area.
The Synchronization summary displayed with data such as:
ManageEngine OpManager Integration: Administrator name in which the integrated OpManager is running.
Last data sync status: Status of the most recent synchronization
Last data sync time: Time at which the most recent synchronization was completed.
Schedule: The frequency of data synchronization between Analytics Plus and OpManager
Next Schedule time: Time at which the next data synchronization is scheduled to happen.
Manual Sync done: Number of times the data has been manually synchronized in a particular day.

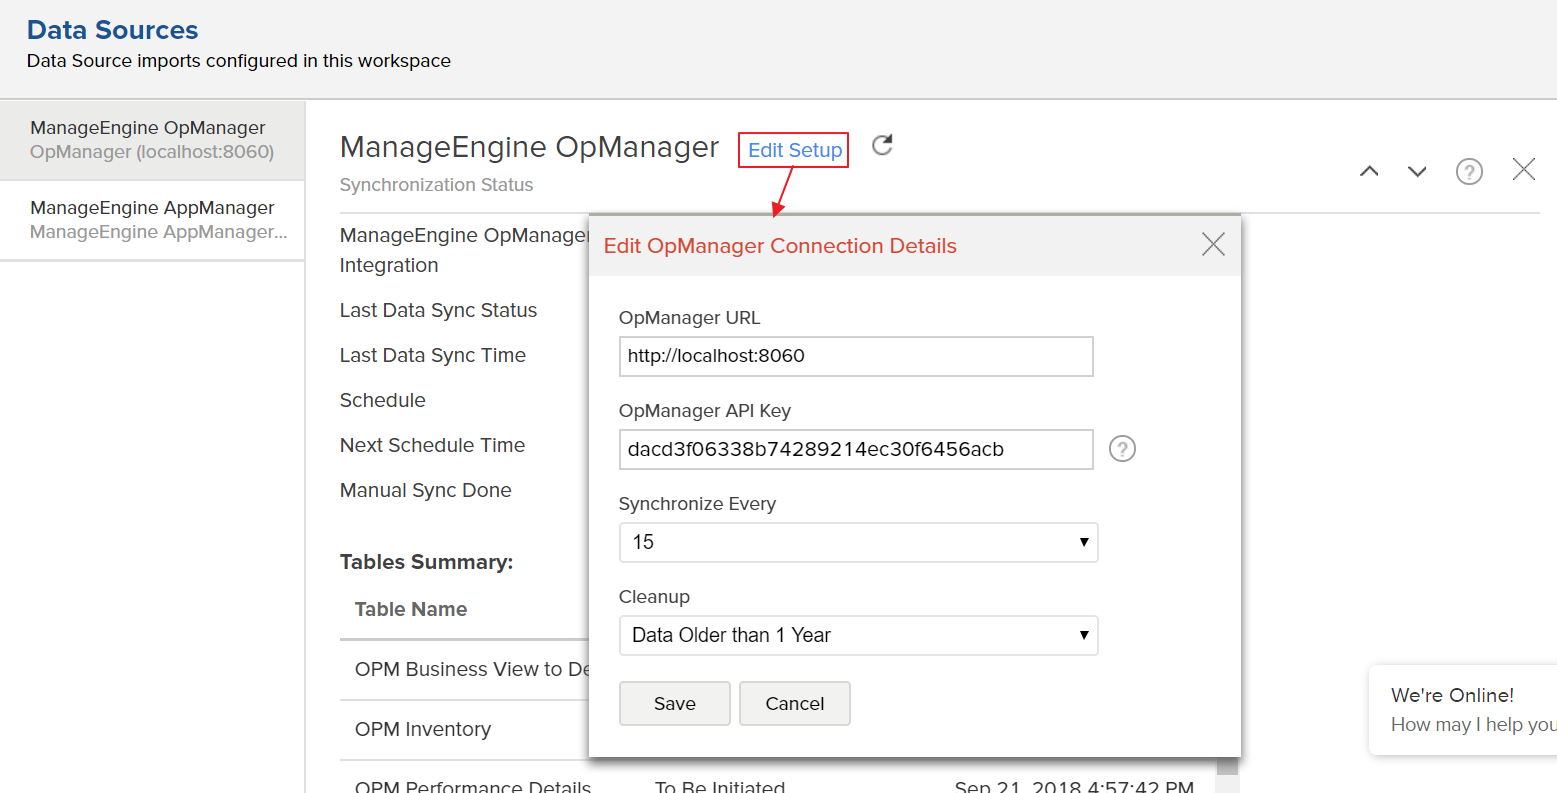
To edit the synchronization settings, click on the "Edit Setup" option that appears on the Synchronization status page.

If the API key becomes invalid or if the OpManager server is moved to a different server, please make the necessary changes in this form and click on "Save" for the changes to take effect.
Data synchronization behaviour
This table describes the synchronization behavior with Opmanager.
Limitations
OpManager and Analytics Plus need to be running in the same time zone.
Technician details and acknowledgement status will not be appended to the OpManager alarms table unless there is a change in alarm severity.
Only the latest 1000 alarms will be synchronized from OpManager.
An attempt to drill down on certain charts, throws an error. You can contact the support team for a workaround on the same.
Categorization of managed and unmanaged devices will not happen when Analytics Plus is synchronized with OpManager Enterprise central server. This may lead to some reports displaying "No data". Analytics Plus can be integrated with the respective probe servers as a temporary workaround.
Known Issues
Combined alarm charts will include unmanaged alarms
Monitor group alarm related charts will include unmanaged monitor alarms.
